
Introduction
In this lab, you will learn how to capture and analyze network traffic using Wireshark, a popular network protocol analyzer. Network traffic analysis is essential in cybersecurity, enabling the identification of potential threats and the monitoring of network activities.
By the end of this lab, you will have gained practical experience in capturing and analyzing network packets with Wireshark, which is a valuable skill for investigating security incidents.
Capturing Network Traffic
In this step, we will learn how to launch Wireshark, capture network traffic, and save it for analysis. Network packet capturing allows you to see all data flowing through your network interfaces, providing visibility into network communications.
What is a Network Packet?
Before we start, let's understand what a network packet is. A packet is a formatted data unit that is transmitted over a network. When you perform any activity on the internet (such as visiting a website, sending an email, or watching a video), the data is broken down into smaller chunks or "packets" and sent over the network to its destination.
Each packet contains:
- Source and destination addresses (similar to the sender and recipient addresses on a letter)
- Payload (the actual data or message content)
- Metadata (information about how to handle the packet)
Real-world application: In cybersecurity, understanding packet structure is fundamental for detecting suspicious behavior. For example, a packet with unusual source addresses or destination ports might indicate someone attempting to scan your network.
Launch Wireshark
First, let us open Wireshark by running the following command in the terminal:
wireshark
After executing this command, the Wireshark application will open. You should see the main Wireshark interface that displays available network interfaces.
The output will look similar to this:
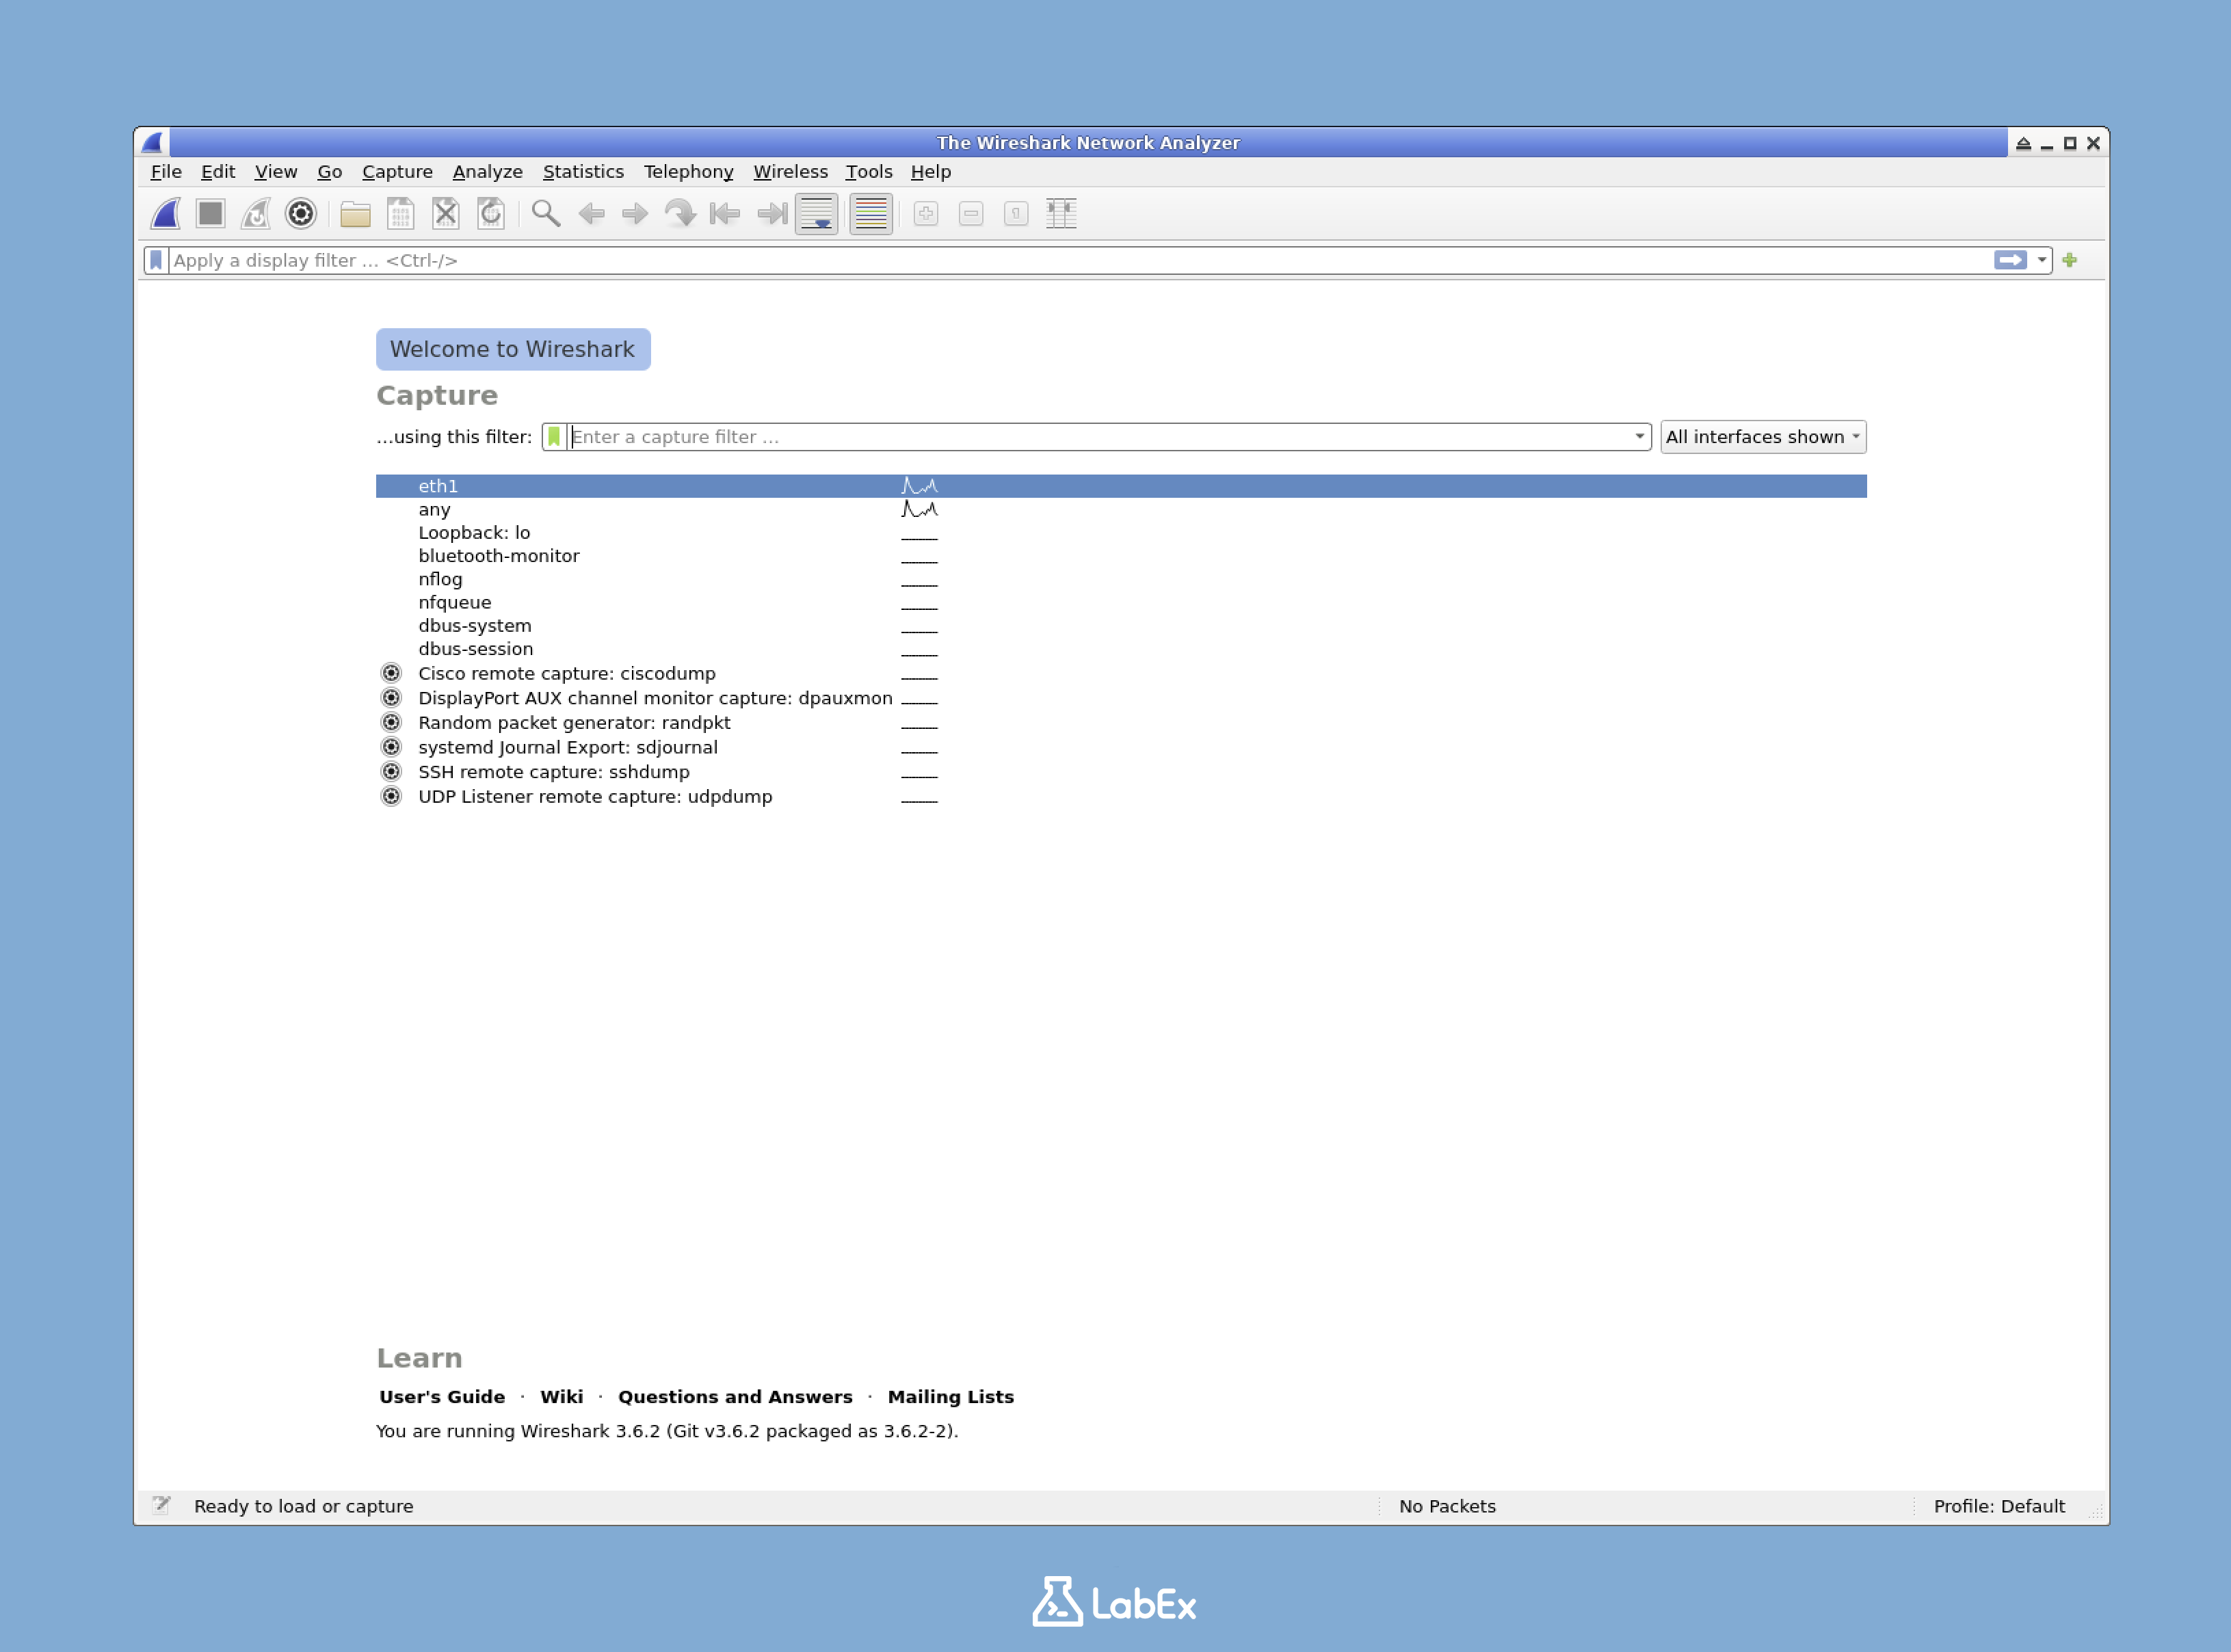
Note for beginners: If this is your first time using Wireshark, don't worry about all the options you see. We'll focus on the essential functions needed for basic packet capture and analysis.
Select a Network Interface
Before you can capture packets, you need to choose which network interface to monitor. Each interface represents a different network connection on your system.
In the Wireshark main window, you will see a list of available network interfaces. Each interface has a small graph beside it showing current activity.
For this lab, double-click on the eth1 interface. This is typically the main Ethernet interface. If you do not see eth1, select any interface that shows activity (a moving graph).
Tip: The graph beside each interface shows the level of network activity on that interface. Choosing an interface with more activity will produce more interesting capture results.
What's happening: When you select an interface, you're telling Wireshark which "network pipe" to listen on. Different interfaces might show different types of traffic - for example, Wi-Fi vs. Ethernet connections.
Start Capturing Packets
Once you select an interface, Wireshark should automatically start capturing packets. If it does not, you can start the capture manually by clicking the blue shark fin icon in the toolbar or by pressing Ctrl+E.
As the capture runs, you will see packets appearing in real-time in the main window:
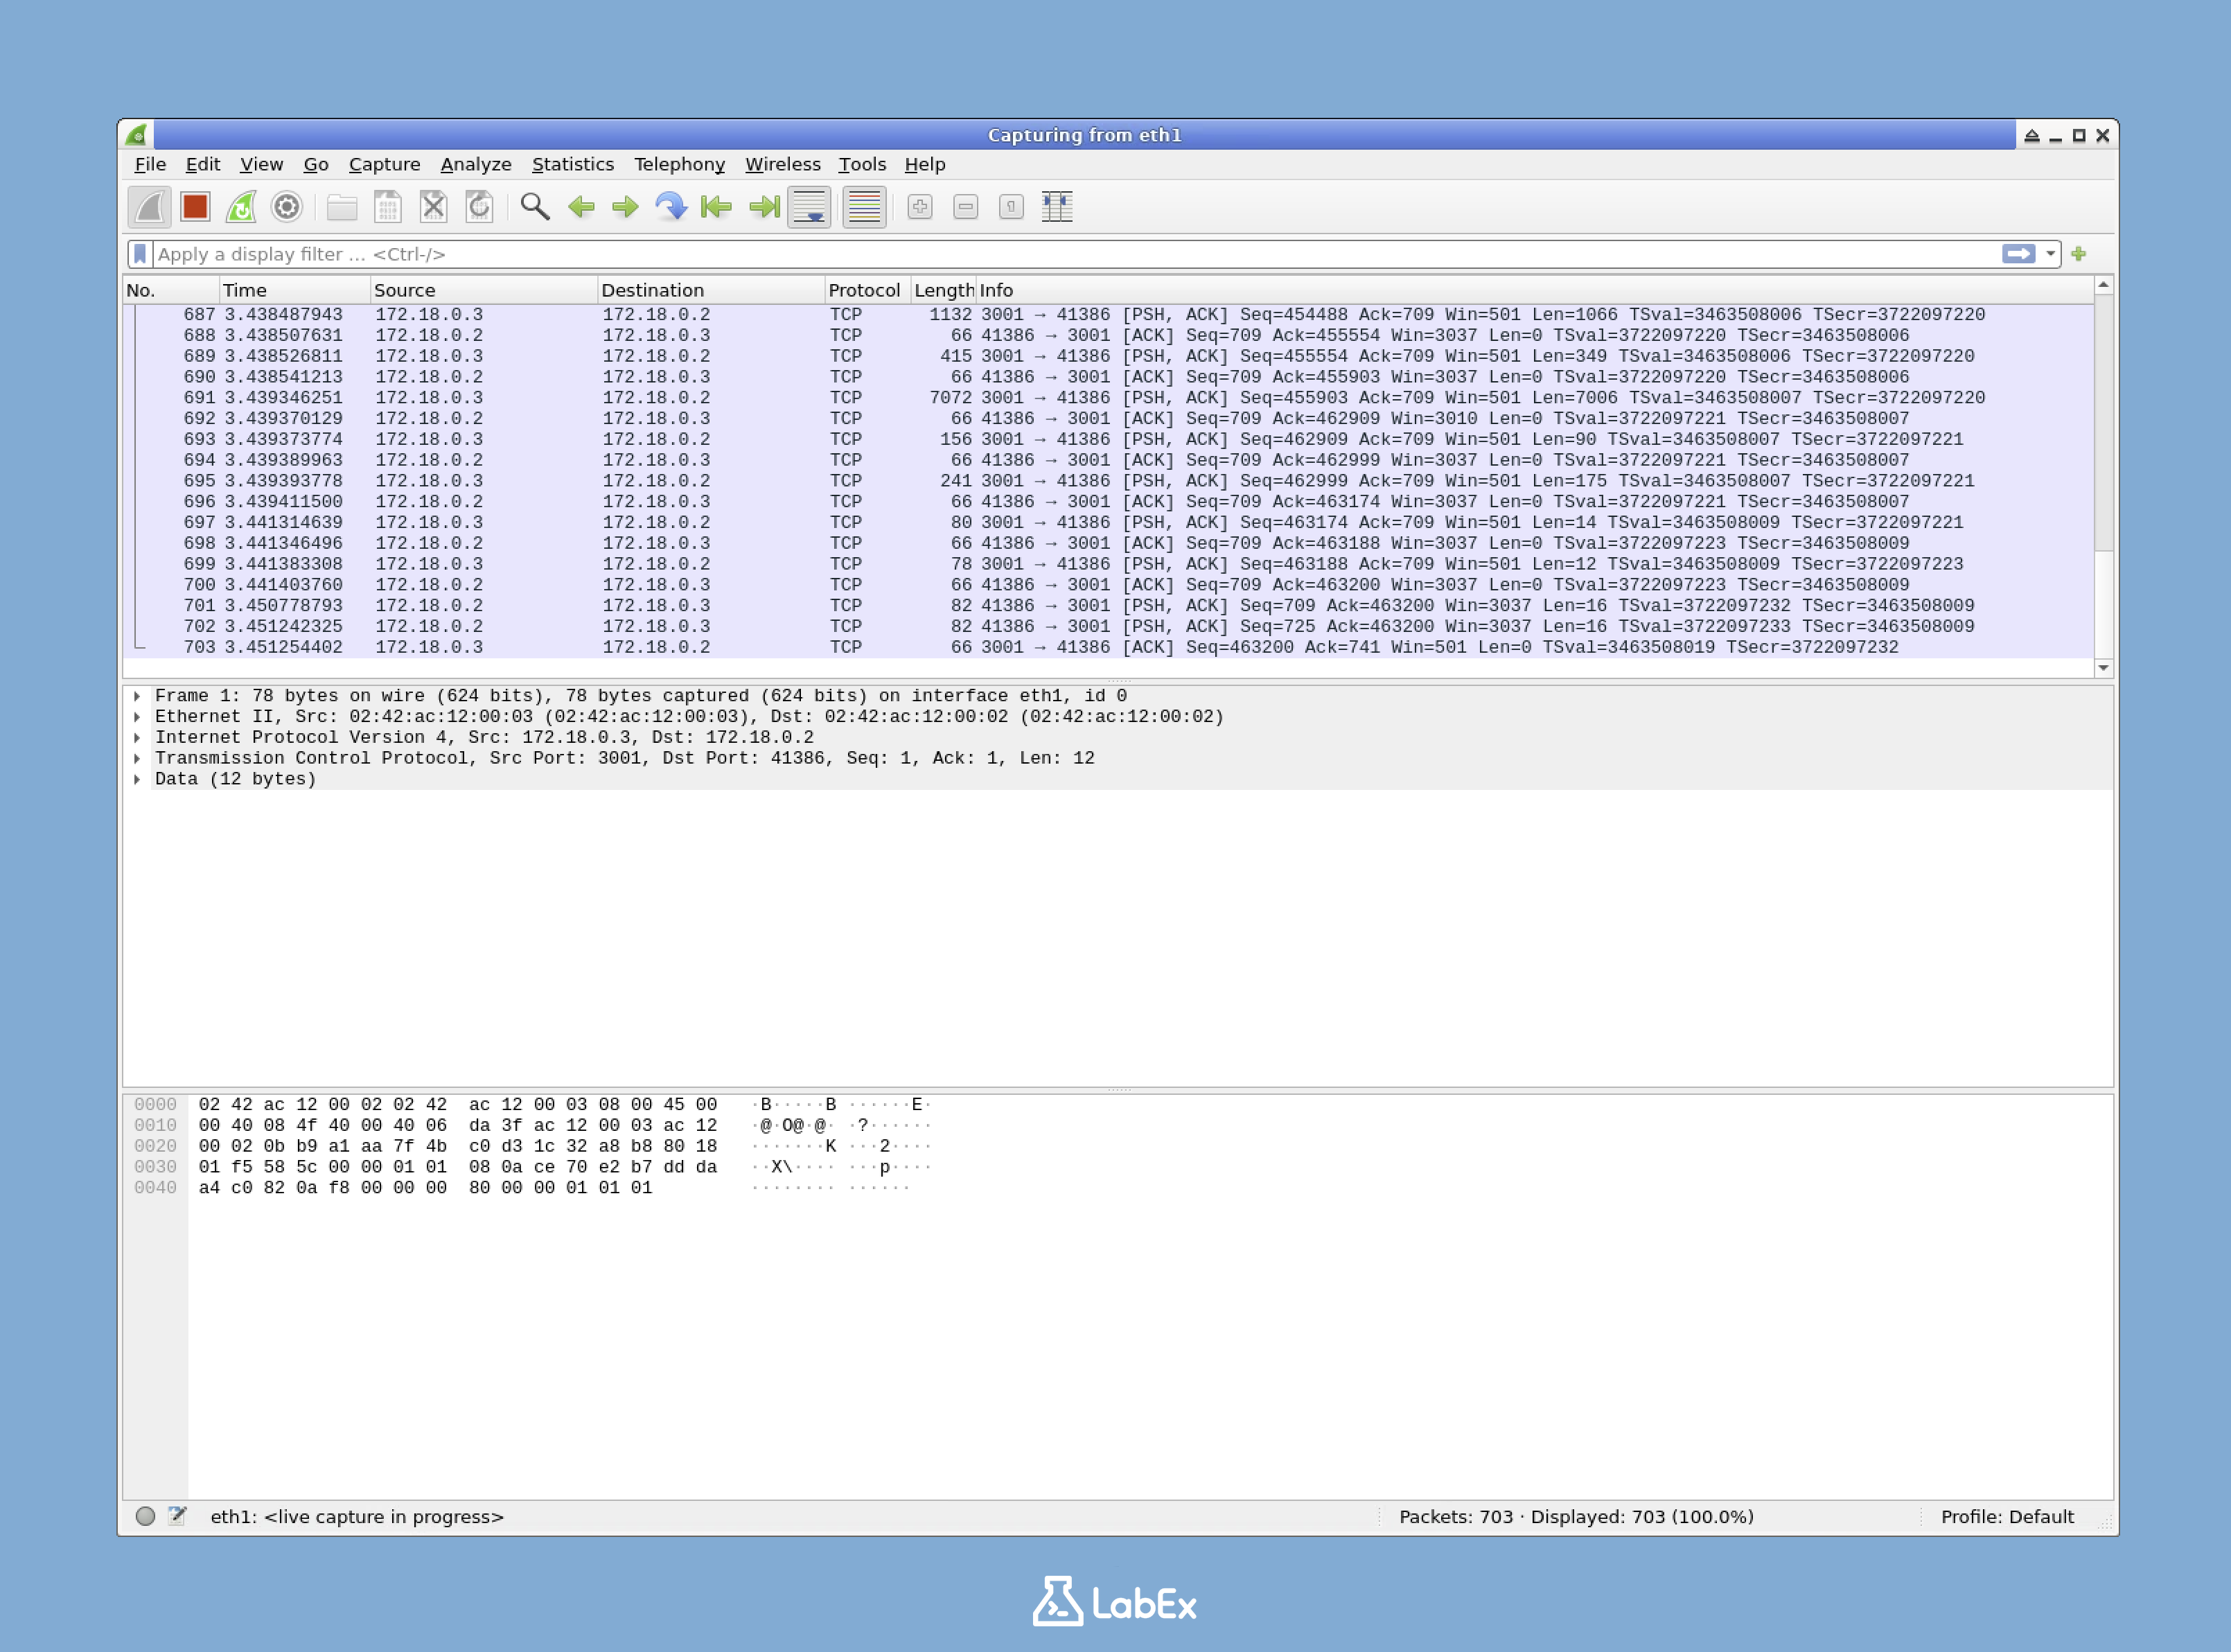
Let the capture run for approximately 30-60 seconds to collect sufficient network traffic for analysis.
Security Note: Remember, Wireshark captures all traffic flowing through the selected network interface. When used in a production environment or on a shared network, ensure you have permission to perform such monitoring, as it may capture sensitive information.
What to expect: During capture, you'll likely see different colored lines rapidly appearing in the display. Each line represents a packet, and the colors indicate different protocols (like blue for TCP, light green for HTTP).
Understanding the Packet List
While capturing, observe the main packet list in the Wireshark window. Each line represents a single packet with several columns of information:
- No.: The packet number in this capture session
- Time: When the packet was captured
- Source: The IP address or hostname of the sending device
- Destination: The IP address or hostname of the receiving device
- Protocol: The network protocol used (TCP, UDP, HTTP, etc.)
- Length: The size of the packet in bytes
- Info: Additional details about the packet
Wireshark uses different colors to highlight various protocols, making it easier to identify different types of traffic.
Deep Dive: The color coding is a powerful feature of Wireshark. For example, red is often used to indicate errors, light blue for TCP traffic, and light green for HTTP traffic. This visual hint helps you quickly identify the traffic you're interested in.
Sorting tip: You can click on any column header to sort the packet list. For example, clicking on the "Protocol" header will group similar protocols together, which is useful when looking for specific types of traffic.
Stop the Capture
After capturing for 30-60 seconds, stop the capture by clicking the red square icon in the toolbar or by pressing Ctrl+E again.
Why stop?: While Wireshark can capture packets indefinitely, stopping after a reasonable period helps keep the file size manageable and makes analysis easier. For specific investigations, you might run captures for longer periods.
Save the Captured Packets
Now let us save the captured network traffic for later analysis:
- Click on
Filein the menu at the top of the Wireshark window - Select
Save As - Navigate to the
/home/labex/projectdirectory - Enter
capture.pcapngas the filename - Click the
Savebutton
The save dialog will look like this:
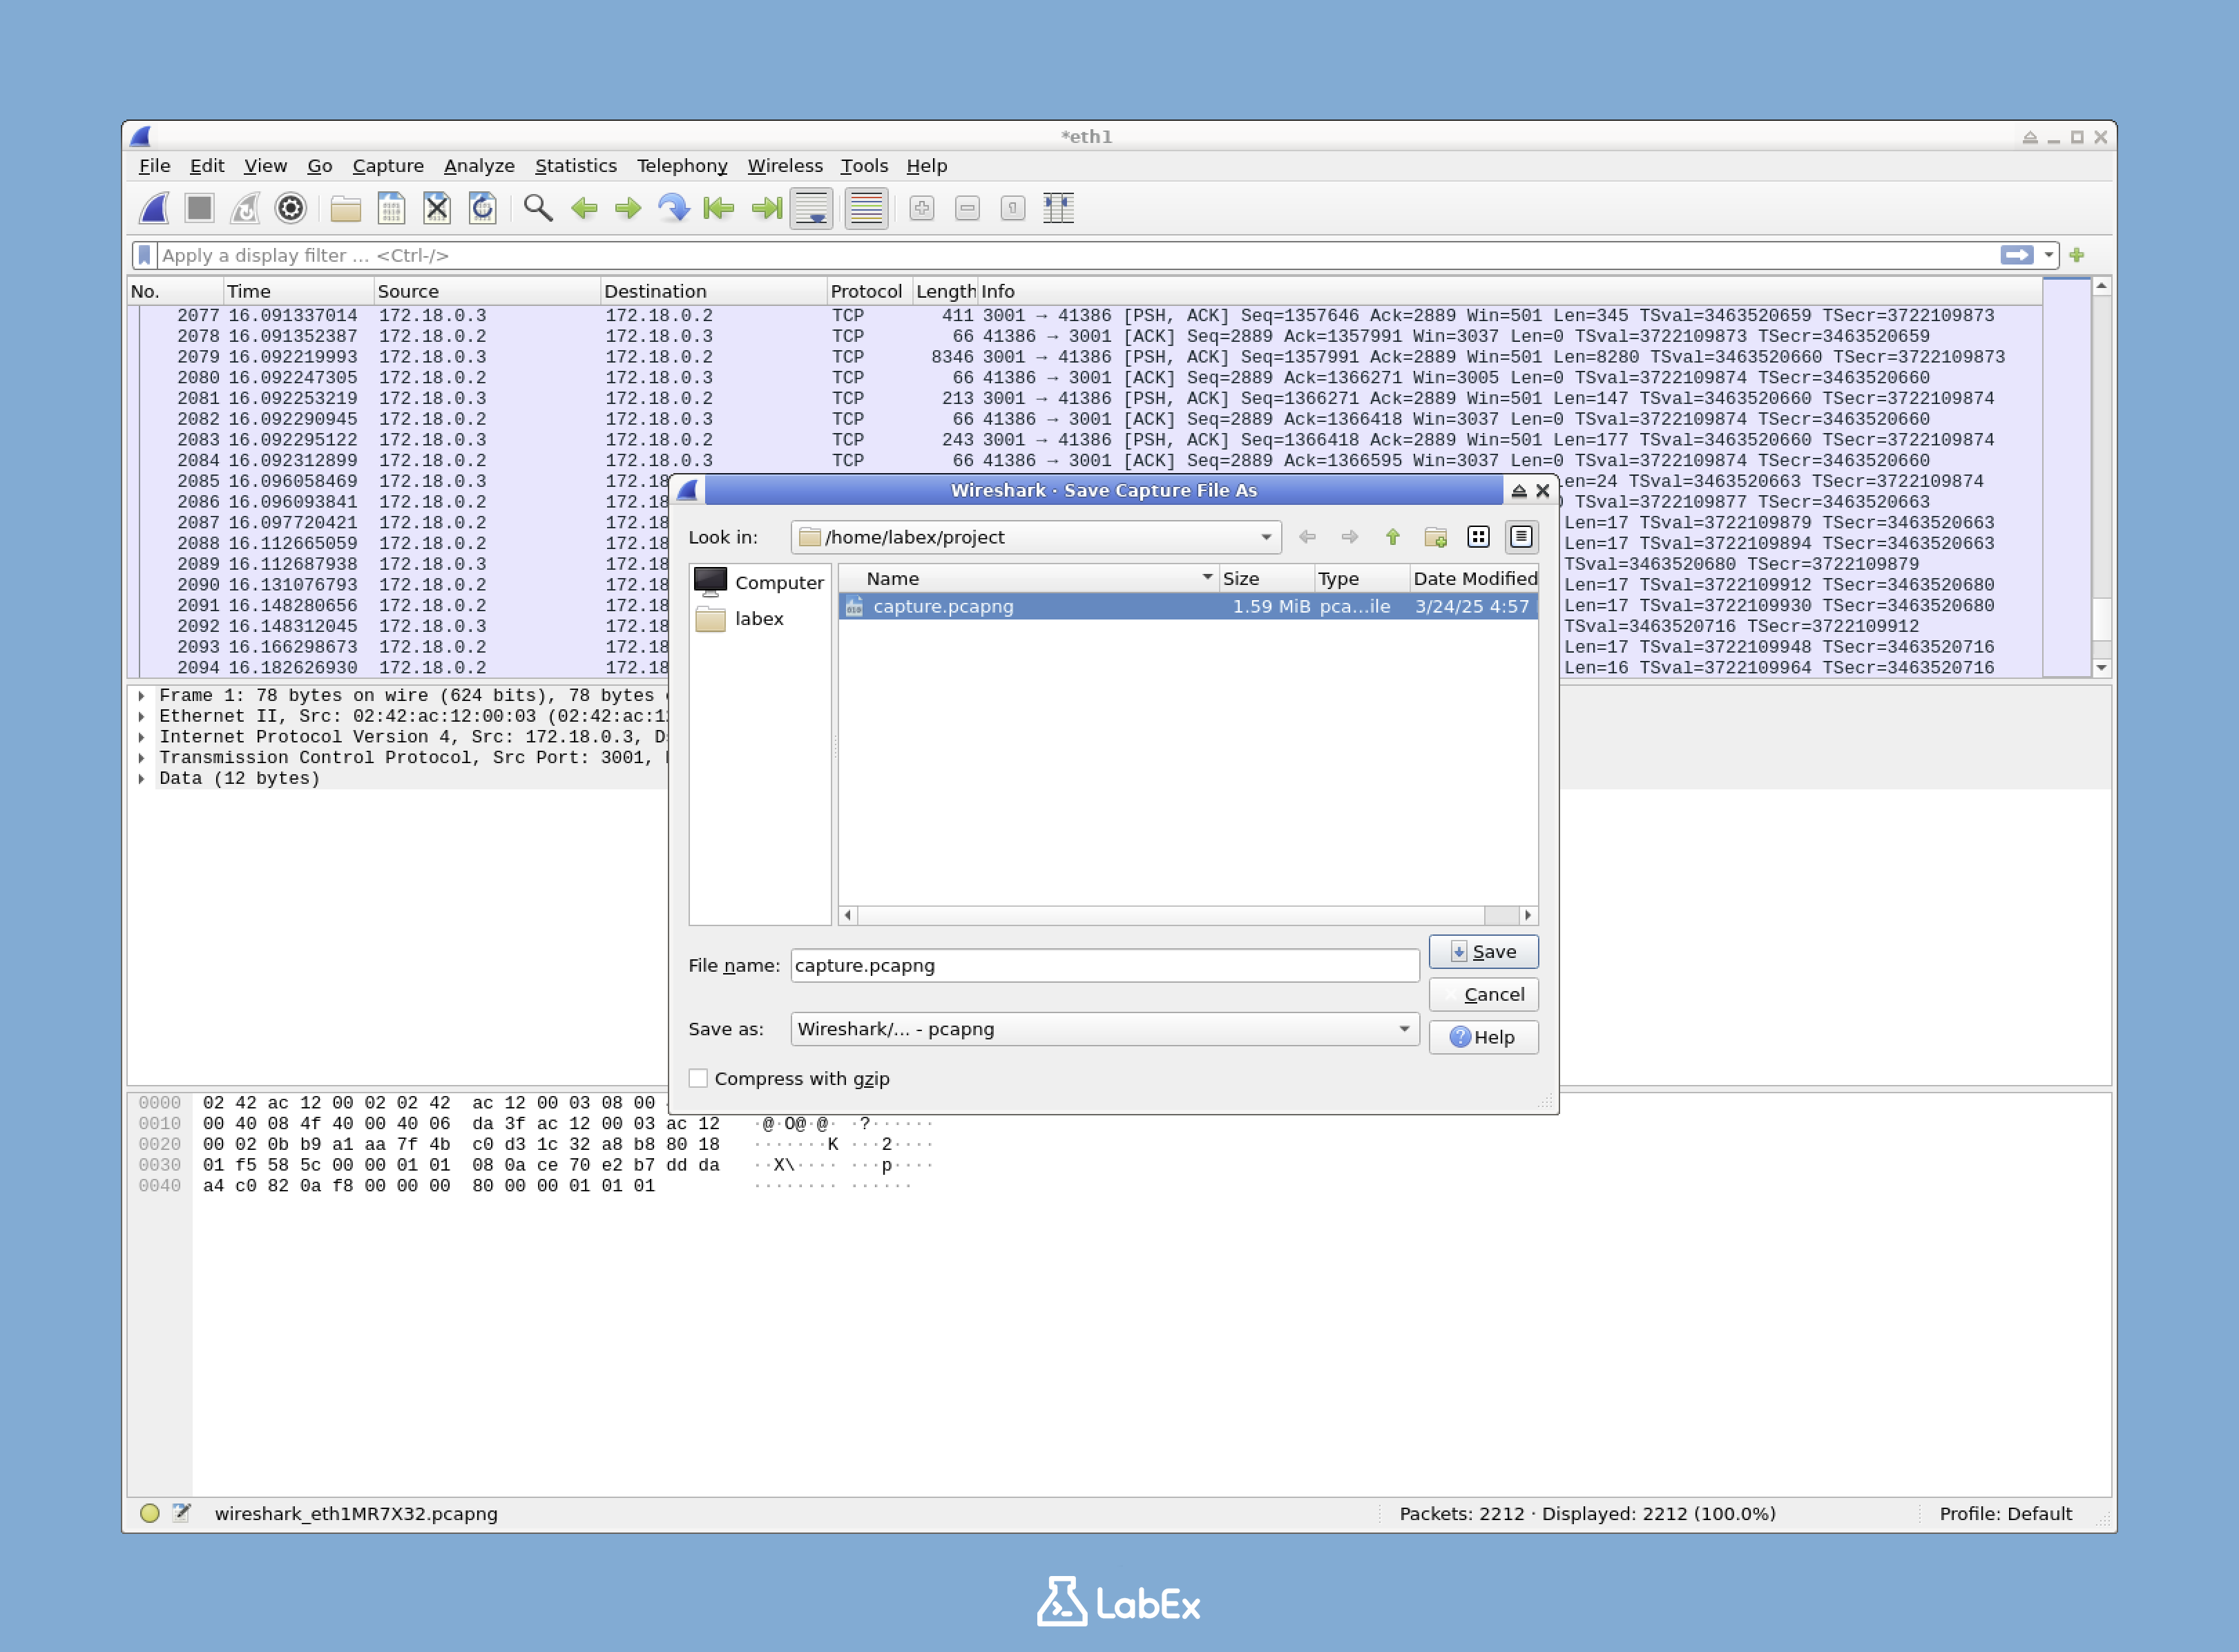
The .pcapng file format is Wireshark's native format for storing packet captures. It contains all the information about your captured packets and can be reopened in Wireshark for further analysis.
Extended Knowledge: Wireshark also supports older .pcap format and other formats for importing/exporting. The .pcapng format provides more features than the older .pcap format, such as support for multiple interface captures and packet annotations.
You have now successfully captured network traffic and saved it for analysis. In the next step, we will explore how to analyze this captured data.
Understanding the Wireshark Interface
Now that you have captured network traffic, let's learn how to analyze it using Wireshark's interface. Understanding this interface is essential for effective network traffic analysis.
The Wireshark Interface Layout
The Wireshark interface is divided into three main panes:
- Packet List Pane (top): Shows all captured packets with basic information
- Packet Details Pane (middle): Displays detailed information about the selected packet
- Packet Bytes Pane (bottom): Shows the raw data of the selected packet in hexadecimal and ASCII format
To examine a packet in detail, simply click on it in the Packet List Pane. The details of that packet will appear in the lower panes.
This three-pane layout design allows you to view both high-level overview and low-level details, which is crucial for comprehensive network analysis.
Customization Tip: Wireshark allows you to customize the interface layout. You can resize each pane by dragging the dividers between them, or hide a pane completely by right-clicking on a divider and selecting "Hide". If you accidentally hide a pane, you can restore it through View > Panes in the menu.
Navigating the Wireshark Interface
To inspect a packet in detail:
- Click on a packet in the Packet List Pane
- The details of that packet will appear in the lower panes
- Browse the Packet Details Pane to view structured information about the packet
- View the Packet Bytes Pane to understand the raw hexadecimal and ASCII representation of the packet
Practice Tip: Try selecting different packets in the Packet List Pane and observe how the other two panes update to display information about the selected packet. Try packets with different protocol types to see the varying information they contain.
Understanding the Packet Details Pane
The Packet Details Pane shows layered packet information reflecting the network protocol stack:
- Frame Layer: Physical information about the packet capture (capture time, frame length)
- Ethernet Layer: Contains MAC address and other link layer information
- Internet Protocol (IP) Layer: Contains IP address information
- Transport Layer (TCP/UDP): Contains port numbers and session information
- Application Layer (HTTP, DNS, etc.): Contains application-specific data
Background Knowledge: This layered reflection follows the OSI (Open Systems Interconnection) model or the TCP/IP model, which is the standard model for network communication. Understanding these layers helps you understand how network communication works.
Visualization: Think of these layers like an envelope within an envelope. The outermost layer (Frame) contains everything. Inside that is the Ethernet layer, then the IP layer, and so on. Each layer adds its own addressing and control information to ensure the data reaches its destination correctly.
Checking Packet Details
To understand a specific packet in depth:
- Click on a packet in the Packet List Pane
- In the Packet Details Pane, expand sections by clicking the arrow (►) next to each field
- As you select different fields in the Packet Details Pane, the corresponding bytes will be highlighted in the Packet Bytes Pane
This allows you to inspect every aspect of a packet, from the low-level Ethernet frame to the high-level application data.
For example, if you select an HTTP packet and expand the "Hypertext Transfer Protocol" section, you can see details of the HTTP request or response:
- Request method (GET, POST, etc.)
- Header information (User-Agent, Content-Type, etc.)
- Status code and response message
Hands-On Exercise: Try finding an HTTP packet and expanding its details. Check the request URL, status code, or other interesting HTTP header information. If you can't find an HTTP packet, try opening a website on the network to generate some HTTP traffic.
Troubleshooting Tip: When investigating network problems, pay special attention to fields highlighted in red or containing words like "error," "warning," or "malformed." These often indicate potential issues that might be causing network problems.
Using Wireshark's Navigation Tools
Wireshark provides several useful navigation tools to help you browse through the capture:
- Filter Toolbar: Located at the top of the main window, allowing you to filter displayed packets
- Zoom Tools: Allowing you to zoom in or out on the time axis view
- Color Coding: Different types of packets use different colors, making it easier to visually identify
- Find Feature (Ctrl+F): Allowing you to search for specific information within packet content
Time Display Options: By default, Wireshark displays time relative to the start of the capture. You can change this by right-clicking on the Time column and selecting a different "Time Display Format," such as absolute time or date and time.
Navigation Shortcut: Press Ctrl+G to jump to a specific packet number, which is useful when analyzing large captures or when following references to specific packets in documentation.
By familiarizing yourself with these tools, you will be able to browse and analyze network captures more effectively.
Using Display Filters
Display filters are one of Wireshark's most powerful features, allowing you to focus on specific types of traffic. This makes analysis more manageable by showing only the packets you're interested in.
Why Filters are Important
Imagine having thousands or even millions of packets in your capture. Finding specific information in such a large amount of data can be very difficult. Display filters allow you to "narrow down the search" to only the packets relevant to your analysis.
Real-world example: When troubleshooting a web application issue, you might only be interested in HTTP traffic to a specific server. Using filters, you can instantly focus on just those packets, ignoring unrelated network traffic.
Applying Basic Filters
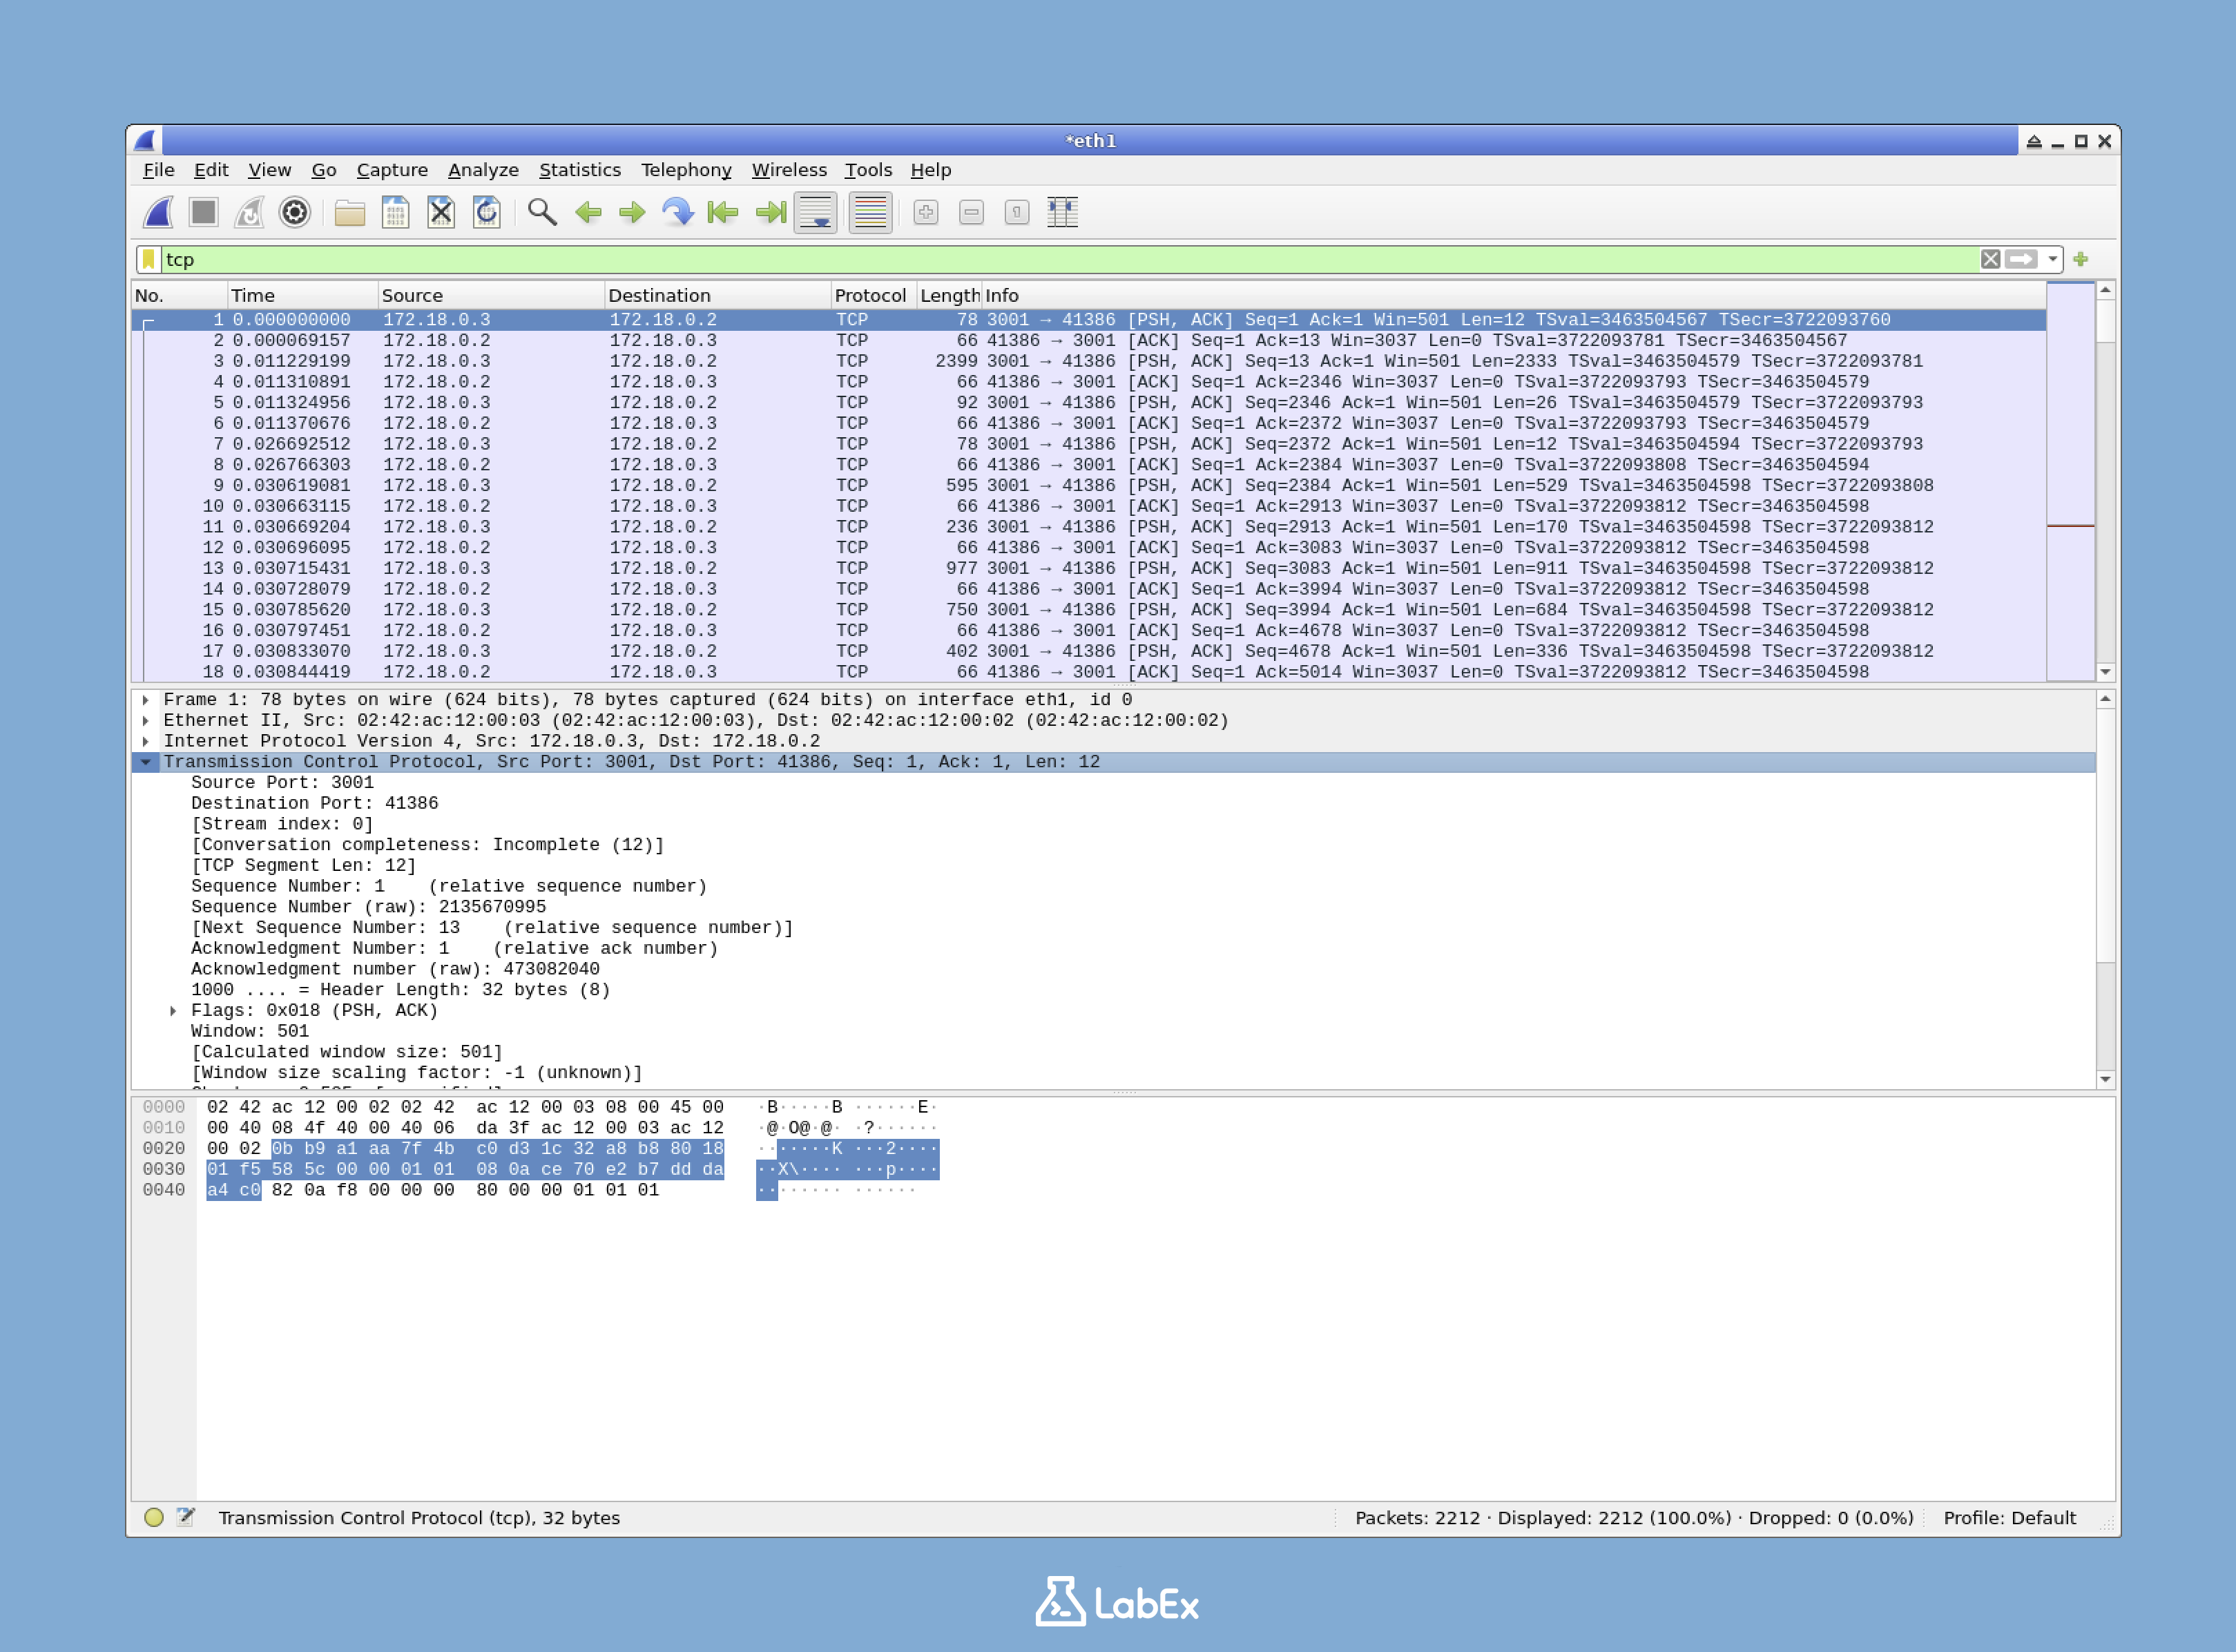
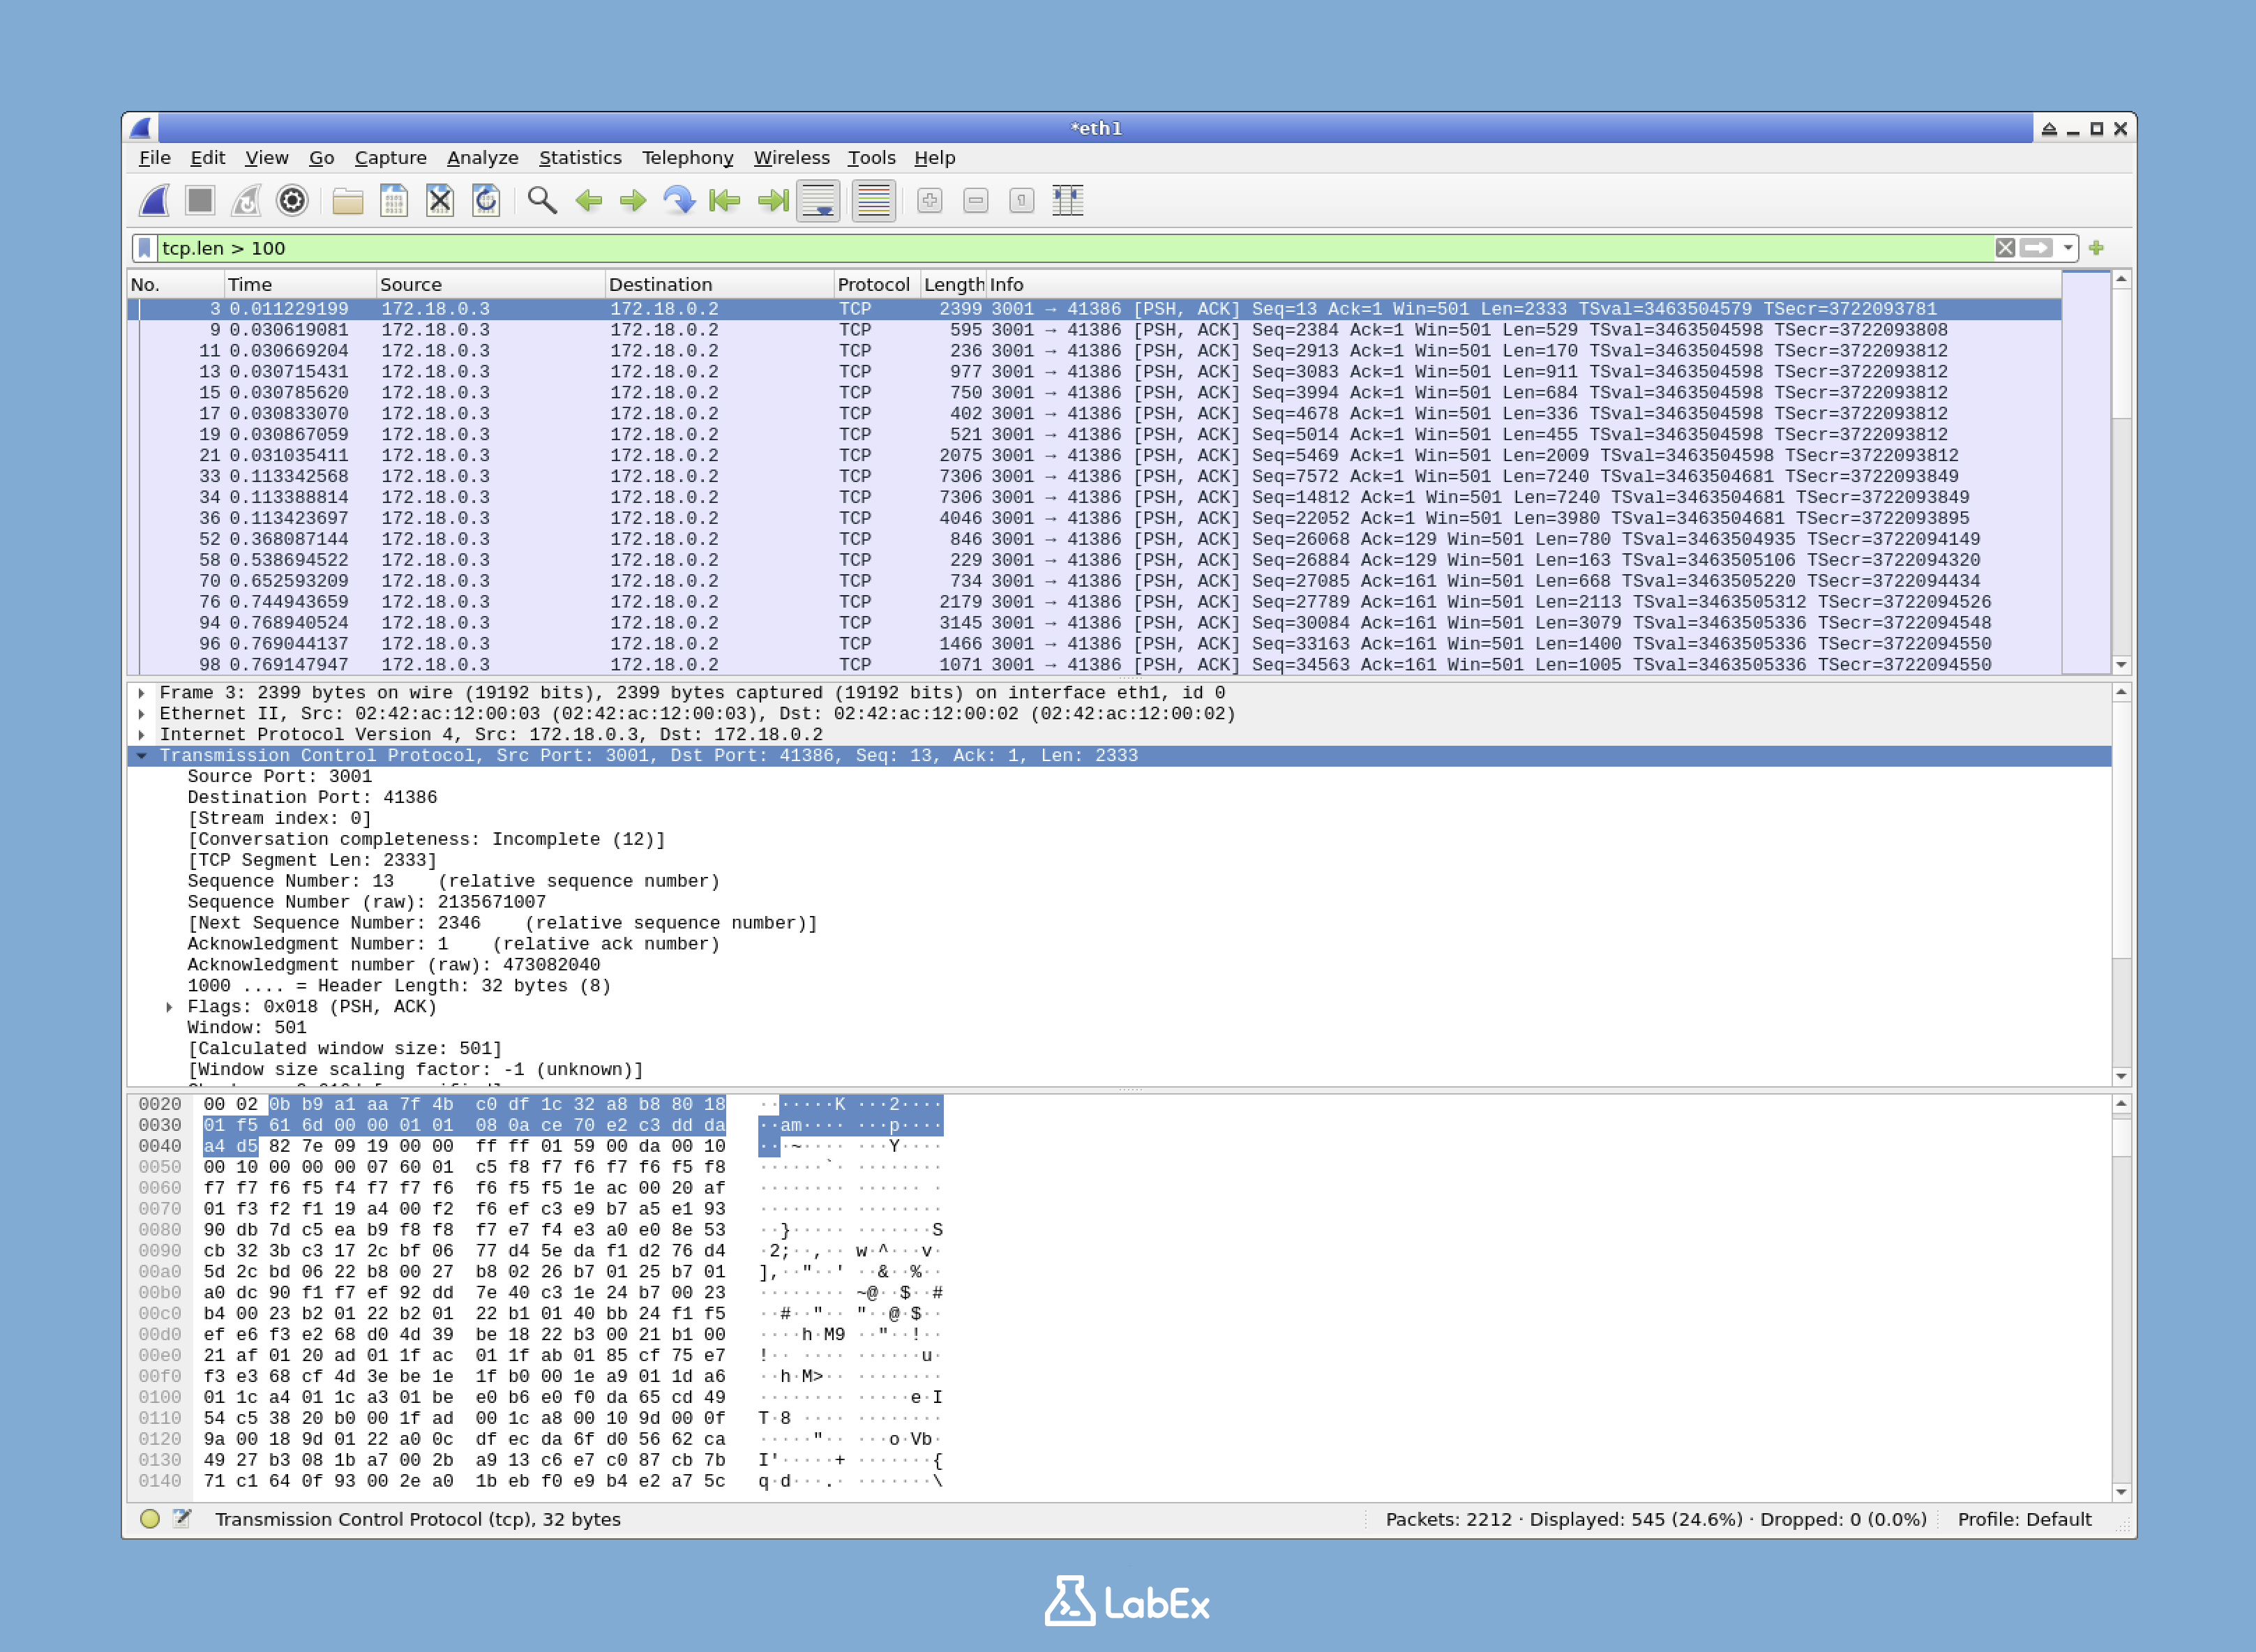
To apply a filter, type it in the filter bar at the top of the window. For example, to show only TCP traffic, enter:
tcp
Press Enter or click the blue arrow button to apply the filter.
The result will show only TCP packets:
Here are some other useful filters you can try:
http: Shows only HTTP trafficdns: Shows only DNS trafficip.addr == 8.8.8.8: Shows traffic to or from the IP address 8.8.8.8tcp.port == 443: Shows only HTTPS traffic
To clear the filter and see all packets again, click the "X" button next to the filter bar.
Filter syntax help: Wireshark's filter bar has built-in assistance. As you type, it will highlight the syntax in green if it's valid, or red if there's an error. You can also press Ctrl+Space for auto-completion suggestions.
History tip: Wireshark remembers your previously used filters. Click the down arrow on the right side of the filter bar to see your filter history.
Advanced Filtering Techniques
Beyond basic filters, Wireshark supports more complex filter expressions:
Comparison operators: Not just equals (==)
tcp.len > 100: TCP packets larger than 100 bytesframe.time_delta <= 0.1: Packets with time difference ≤ 0.1 seconds from previous packet
Compound conditions:
http && !(tcp.port == 80): HTTP traffic but not on standard HTTP port(ip.src == 192.168.1.100 && ip.dst == 8.8.8.8) || (ip.src == 8.8.8.8 && ip.dst == 192.168.1.100): Communication between a specific device and DNS server
Contains and matches:
http contains "password": HTTP traffic containing the string "password"tcp matches "GET [^ ]+ HTTP": TCP packets matching a regular expression for GET requests
Efficiency tip: Mastering filter expressions can dramatically improve your efficiency when analyzing network traffic. Consider saving commonly used filter expressions for quick application.
Using Expression Builder
If you're not sure about the exact filter syntax, Wireshark offers an Expression builder:
- Click on the "Expression..." button next to the filter bar
- Browse through the field name list or start typing to search
- Select a field, choose a relation (==, >, contains, etc.), and enter a value
- Click "OK" to apply the filter
This helps you build complex filters without needing to memorize the exact syntax.
Using Coloring Rules
Wireshark uses colors to help you quickly identify different types of traffic. To view the coloring rules:
- Go to
View>Coloring Rulesin the menu - A dialog will open showing the current coloring rules
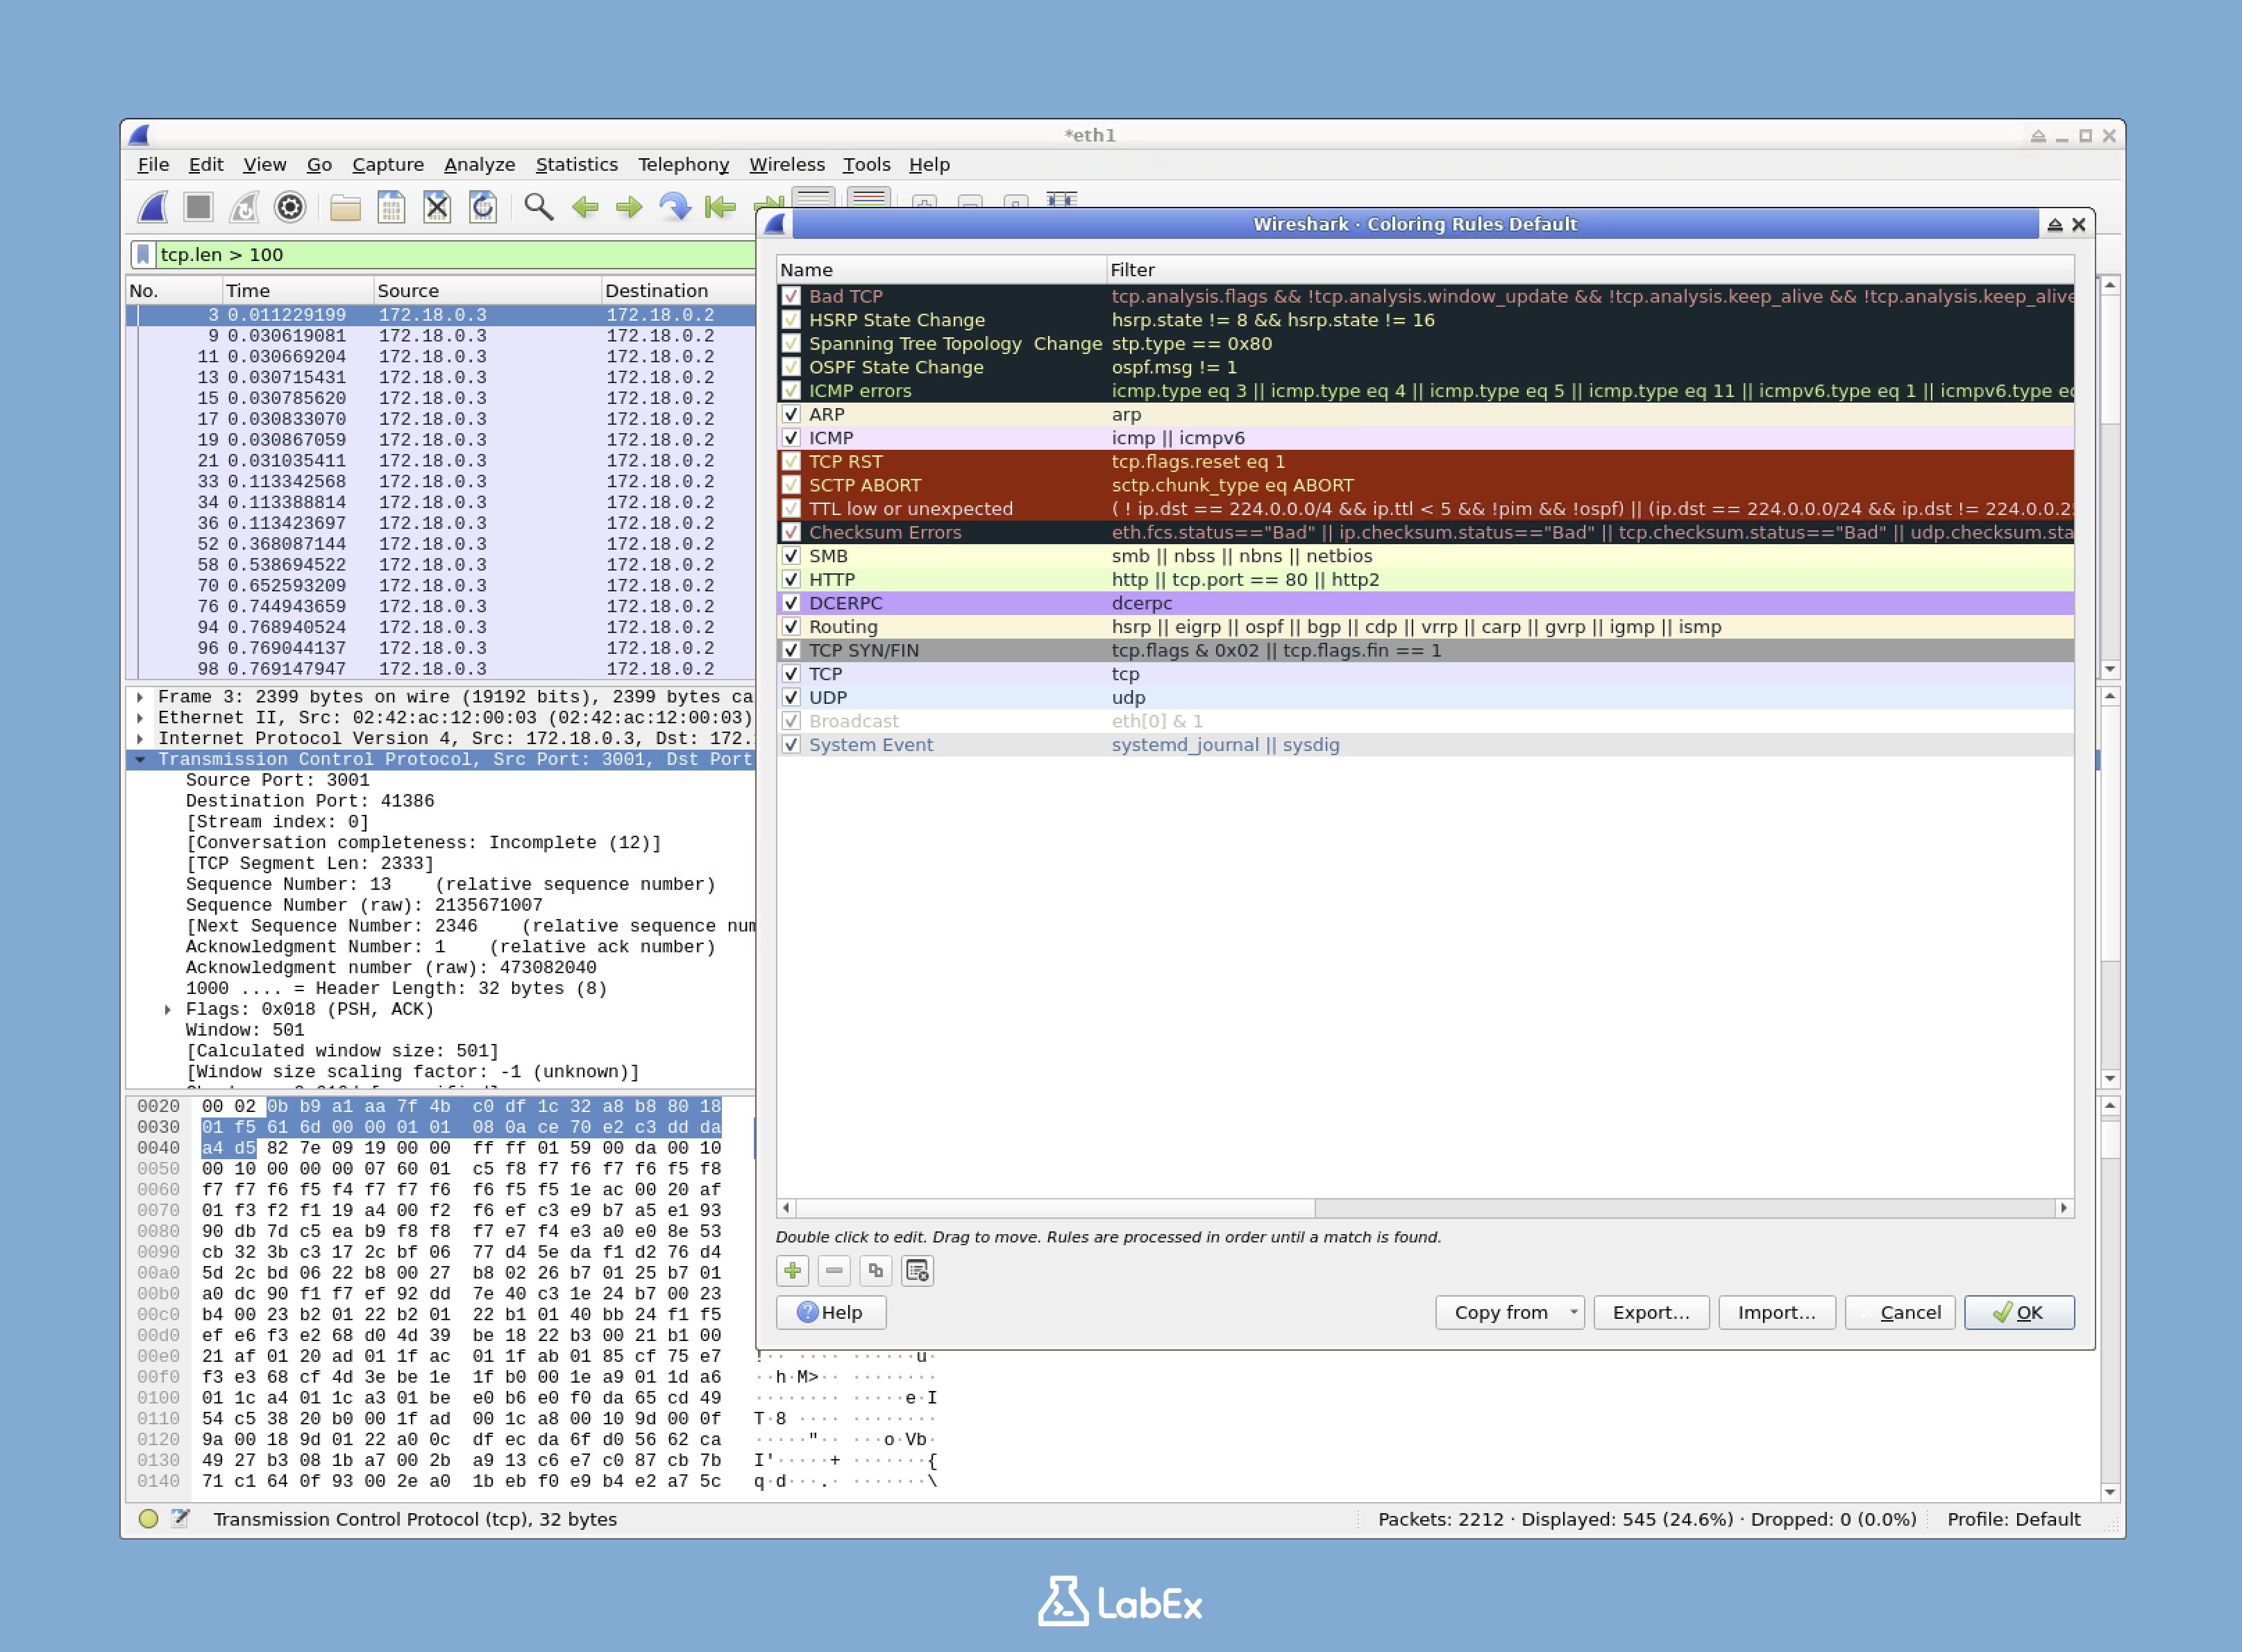
The coloring rules are applied in order from top to bottom. The first rule that matches a packet determines its color. You can enable or disable rules by checking or unchecking the boxes next to them.
Close the Coloring Rules dialog when you are done viewing them.
Custom rules: Creating your own color rules is very useful for those who frequently perform specific types of analysis. For example, you could create special colors for traffic to your company's internal servers, or for specific applications of interest.
Color vs. Filter: Remember that coloring rules highlight packets but still show everything, while filters actually remove non-matching packets from view. Often, it's useful to use coloring to get an overview, then apply filters to focus on specific issues.
Following TCP Streams
One of the most powerful analysis features in Wireshark is the ability to follow TCP streams. A TCP stream represents the entire conversation between two hosts.
What is a TCP Stream?
TCP (Transmission Control Protocol) is one of the most common communication protocols used on the internet. It provides reliable, ordered data transfer. A TCP stream is the collection of all packets exchanged in a single TCP connection, representing the complete conversation between two endpoints.
For example, when your browser connects to a website, it establishes a TCP connection, sends requests, and receives responses through that connection. This entire exchange constitutes a TCP stream.
Why it matters: Network communications often involve many separate packets that only make sense when viewed together. The TCP stream feature reconstructs these fragmented communications into a coherent conversation, making it much easier to understand what's happening at the application level.
Following a TCP Stream
To follow a TCP stream:
- Find a TCP packet in your capture (you can use the
tcpfilter if needed) - Right-click on the packet
- Select
Follow>TCP Stream
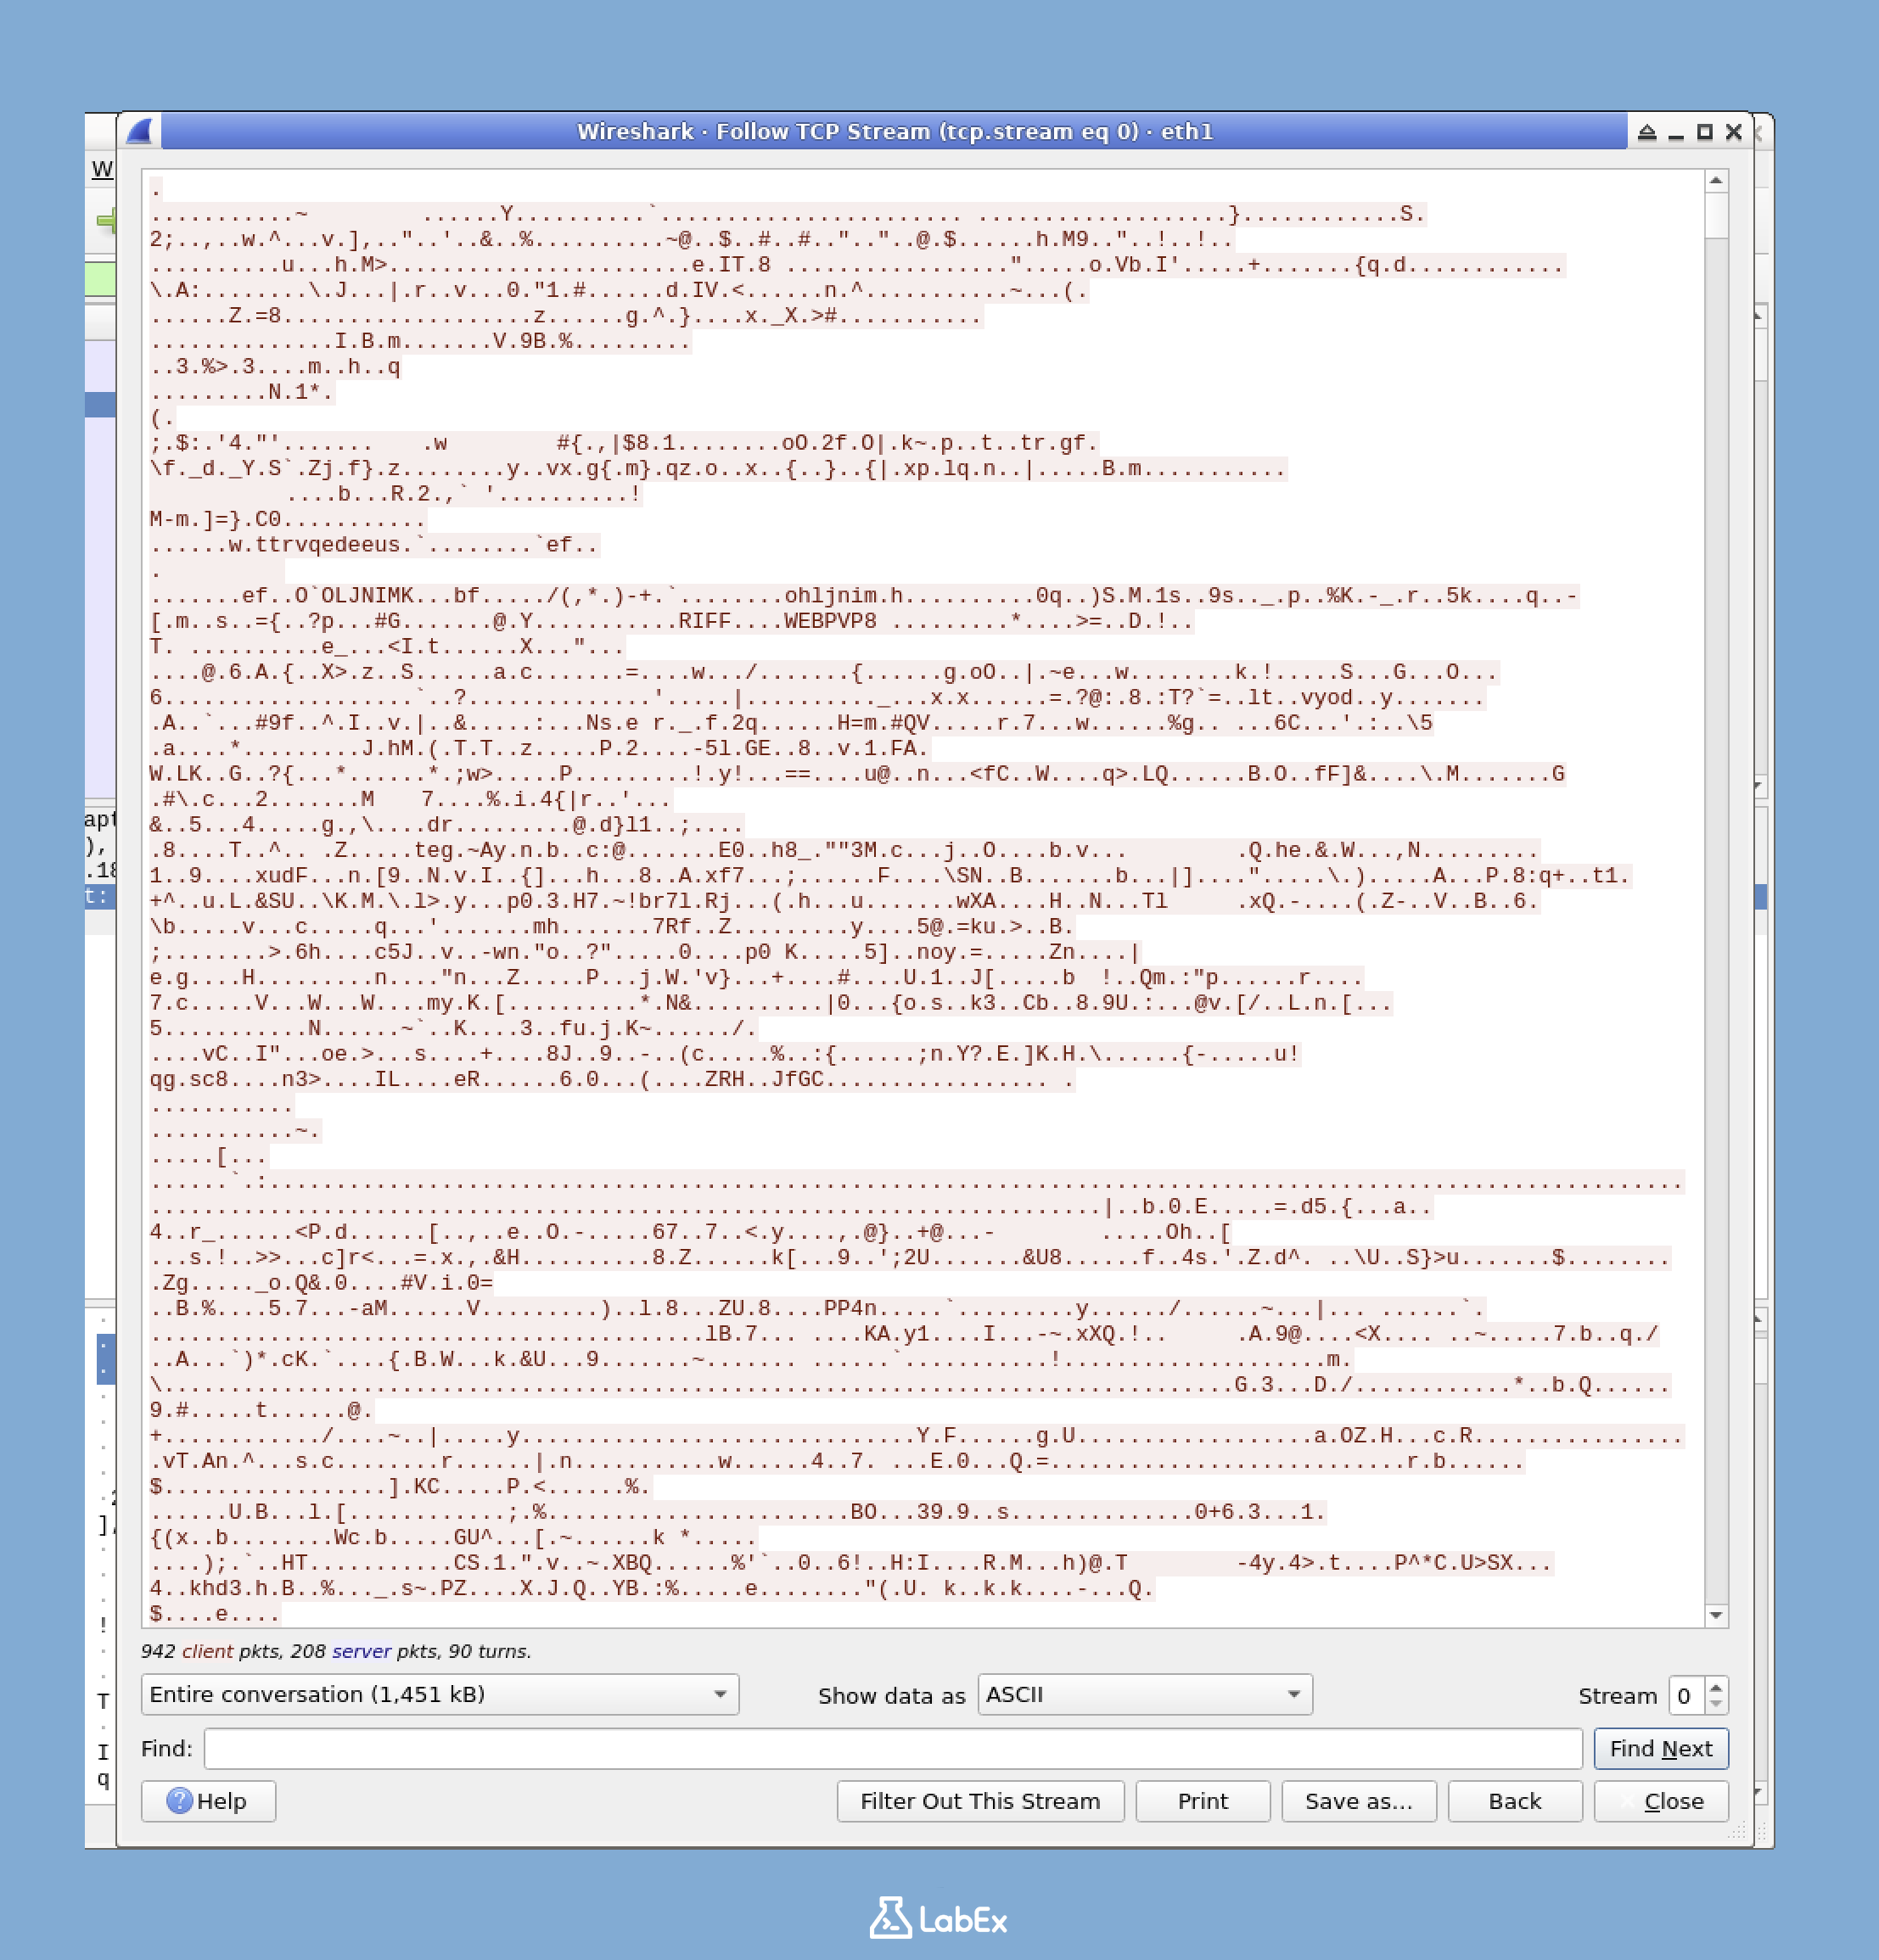
A new window will open showing the complete conversation. Text in red represents data sent from the client to the server, and text in blue represents data sent from the server to the client.
Understanding the colors: Red text (client to server) often includes requests, commands, or uploaded data. Blue text (server to client) typically includes responses, downloaded content, or status messages. This color-coding helps you quickly understand the direction of communication.
Analyzing TCP Stream Content
The TCP stream window provides several useful options for analysis:
Content display options (upper right corner):
- ASCII: Shows content as text, ideal for HTTP and other text-based protocols
- Hex Dump: Shows content in hexadecimal and ASCII, useful for streams containing binary data
- C Arrays: Displays the data as C programming language arrays
- Raw: Shows only the raw data
Let's try the
YAMLformat to see the data in a more readable format.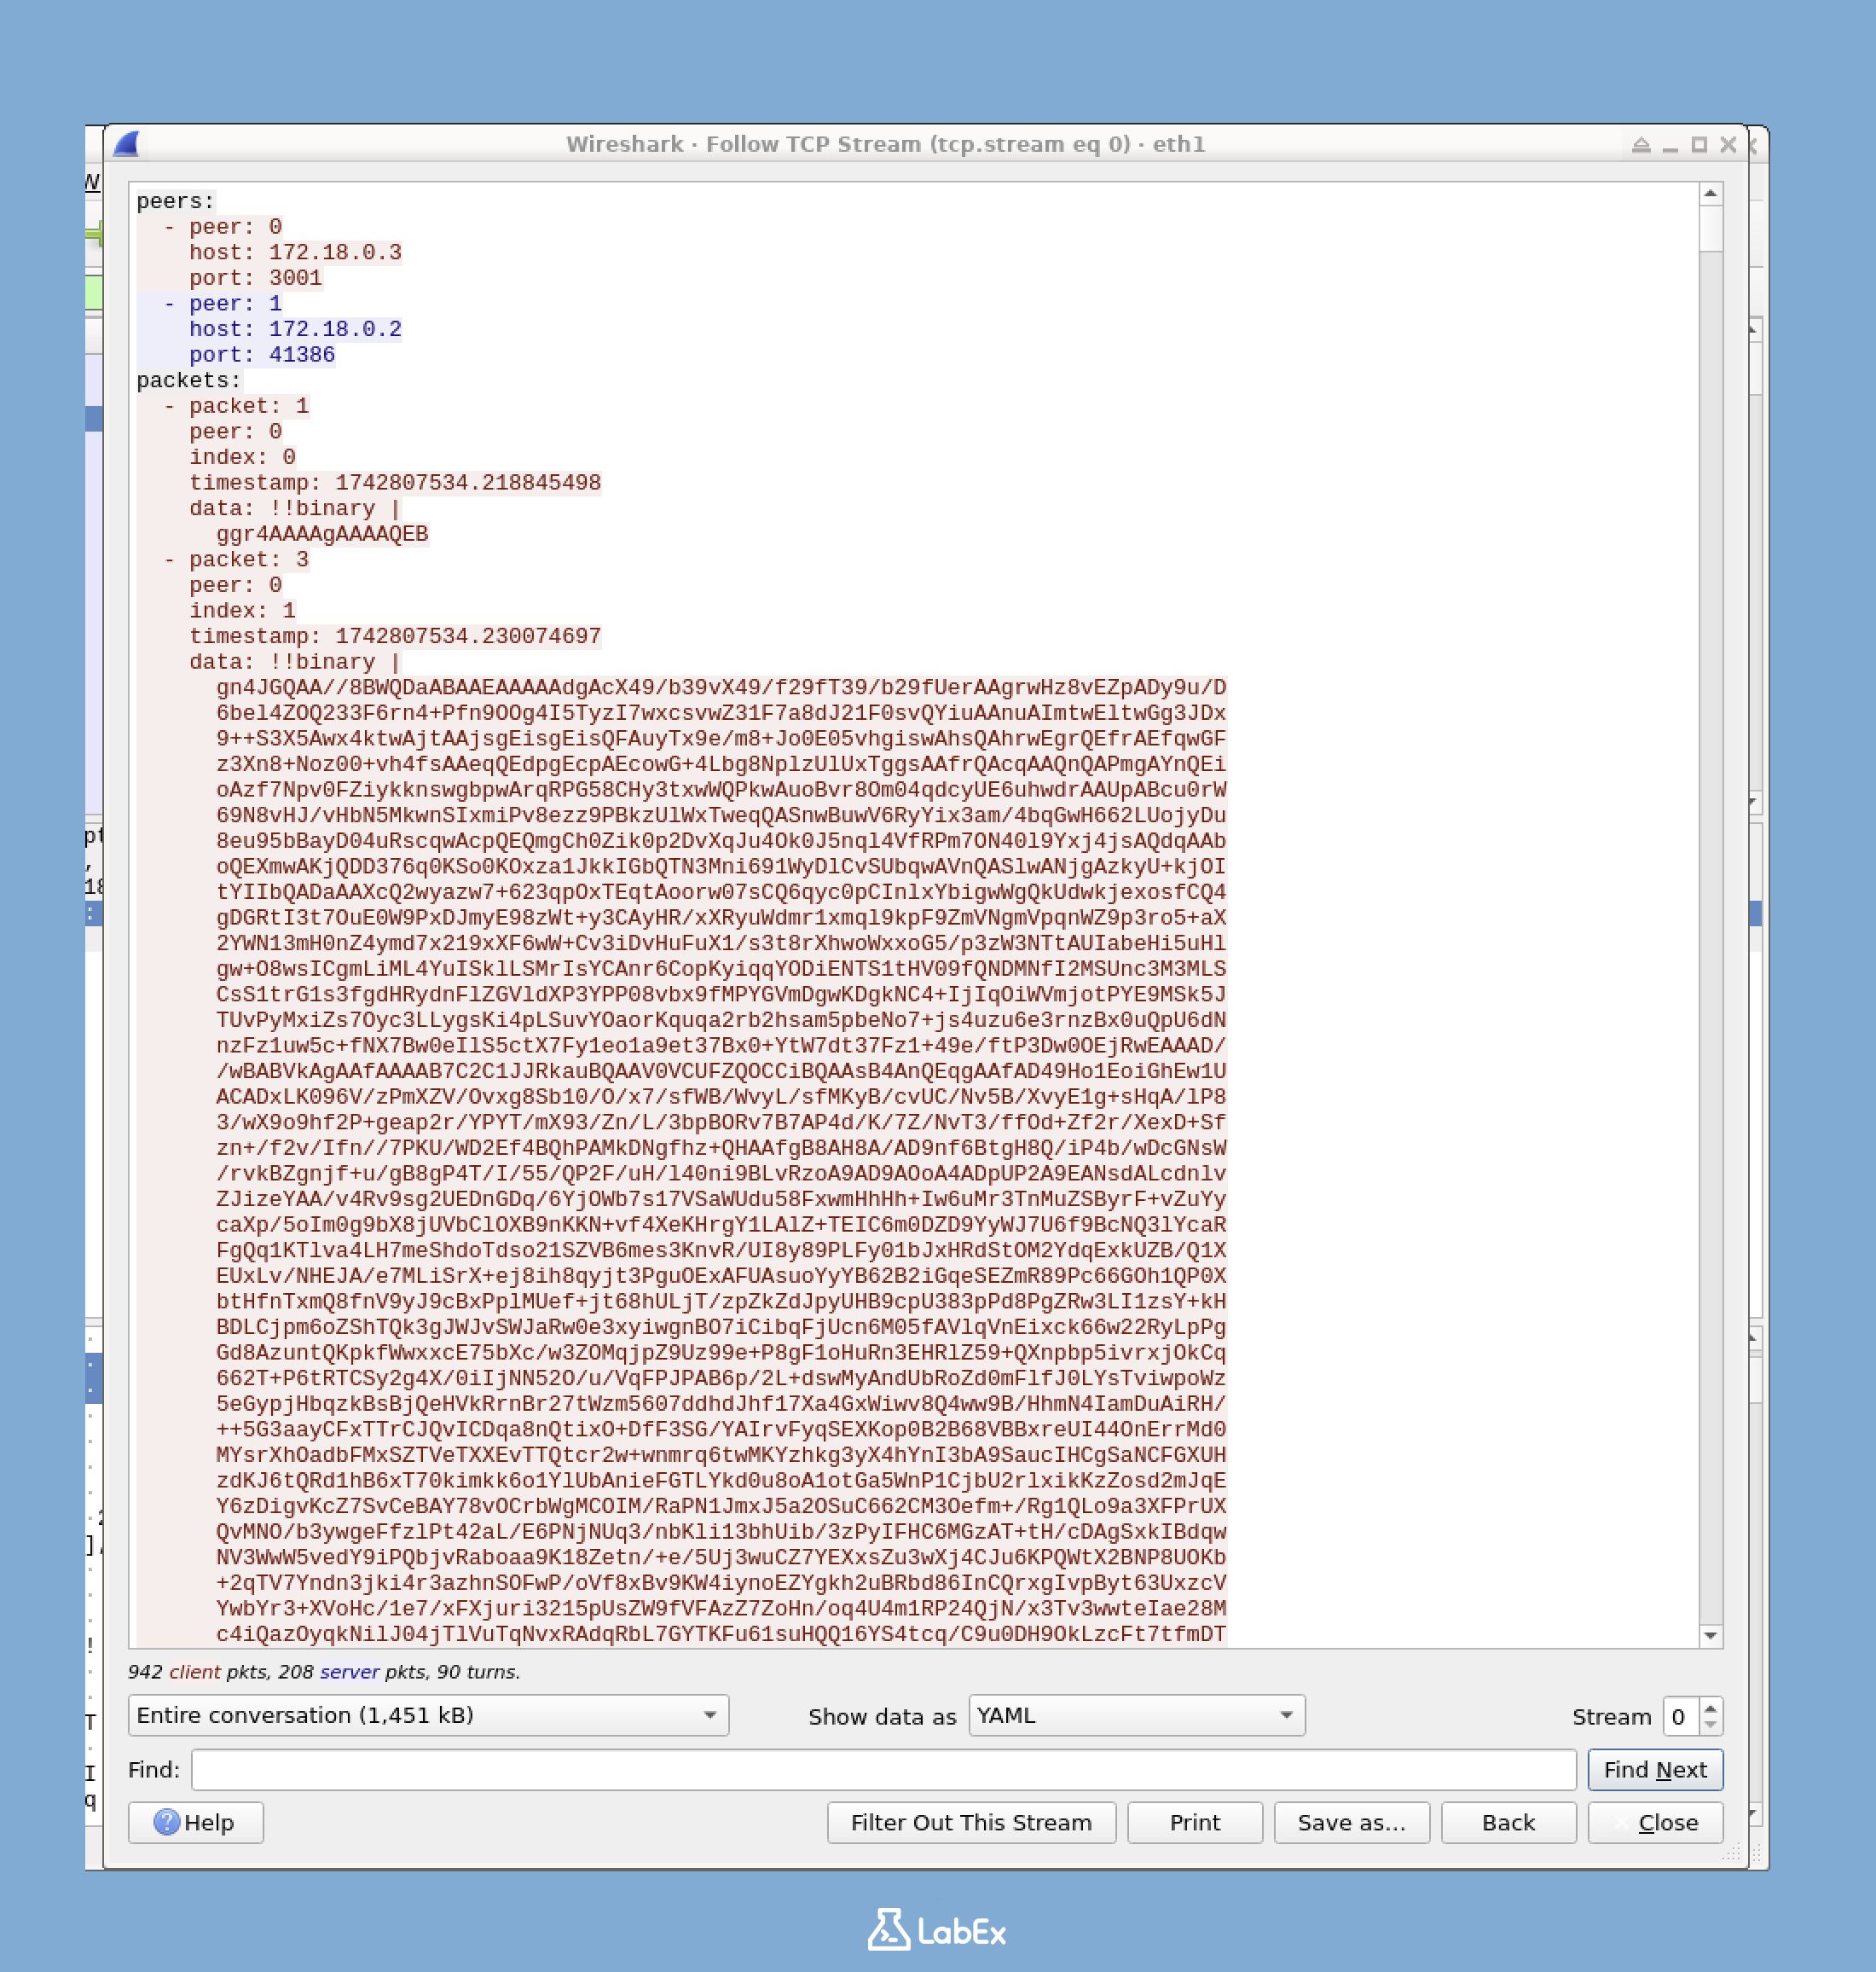
Stream navigation (dropdown menu):
- If your capture contains multiple TCP streams, you can use this menu to navigate between them
- Stream numbers start at 0 and increase in the order they were encountered
Find feature:
- Use Ctrl+F to search within the stream content
- This helps locate specific strings or patterns in large streams
Analysis tip: Different display options can reveal different insights. For instance, switch to "Hex Dump" view to see both hexadecimal values on the left and their ASCII representation on the right. This is helpful when analyzing protocols that mix text and binary data.
Saving TCP Streams
Saving TCP streams is valuable for documentation or offline analysis:
- Click the
Save Asbutton in the TCP stream window - Navigate to the
/home/labex/projectdirectory - Enter
tcp_stream.txtas the filename - Click
Save
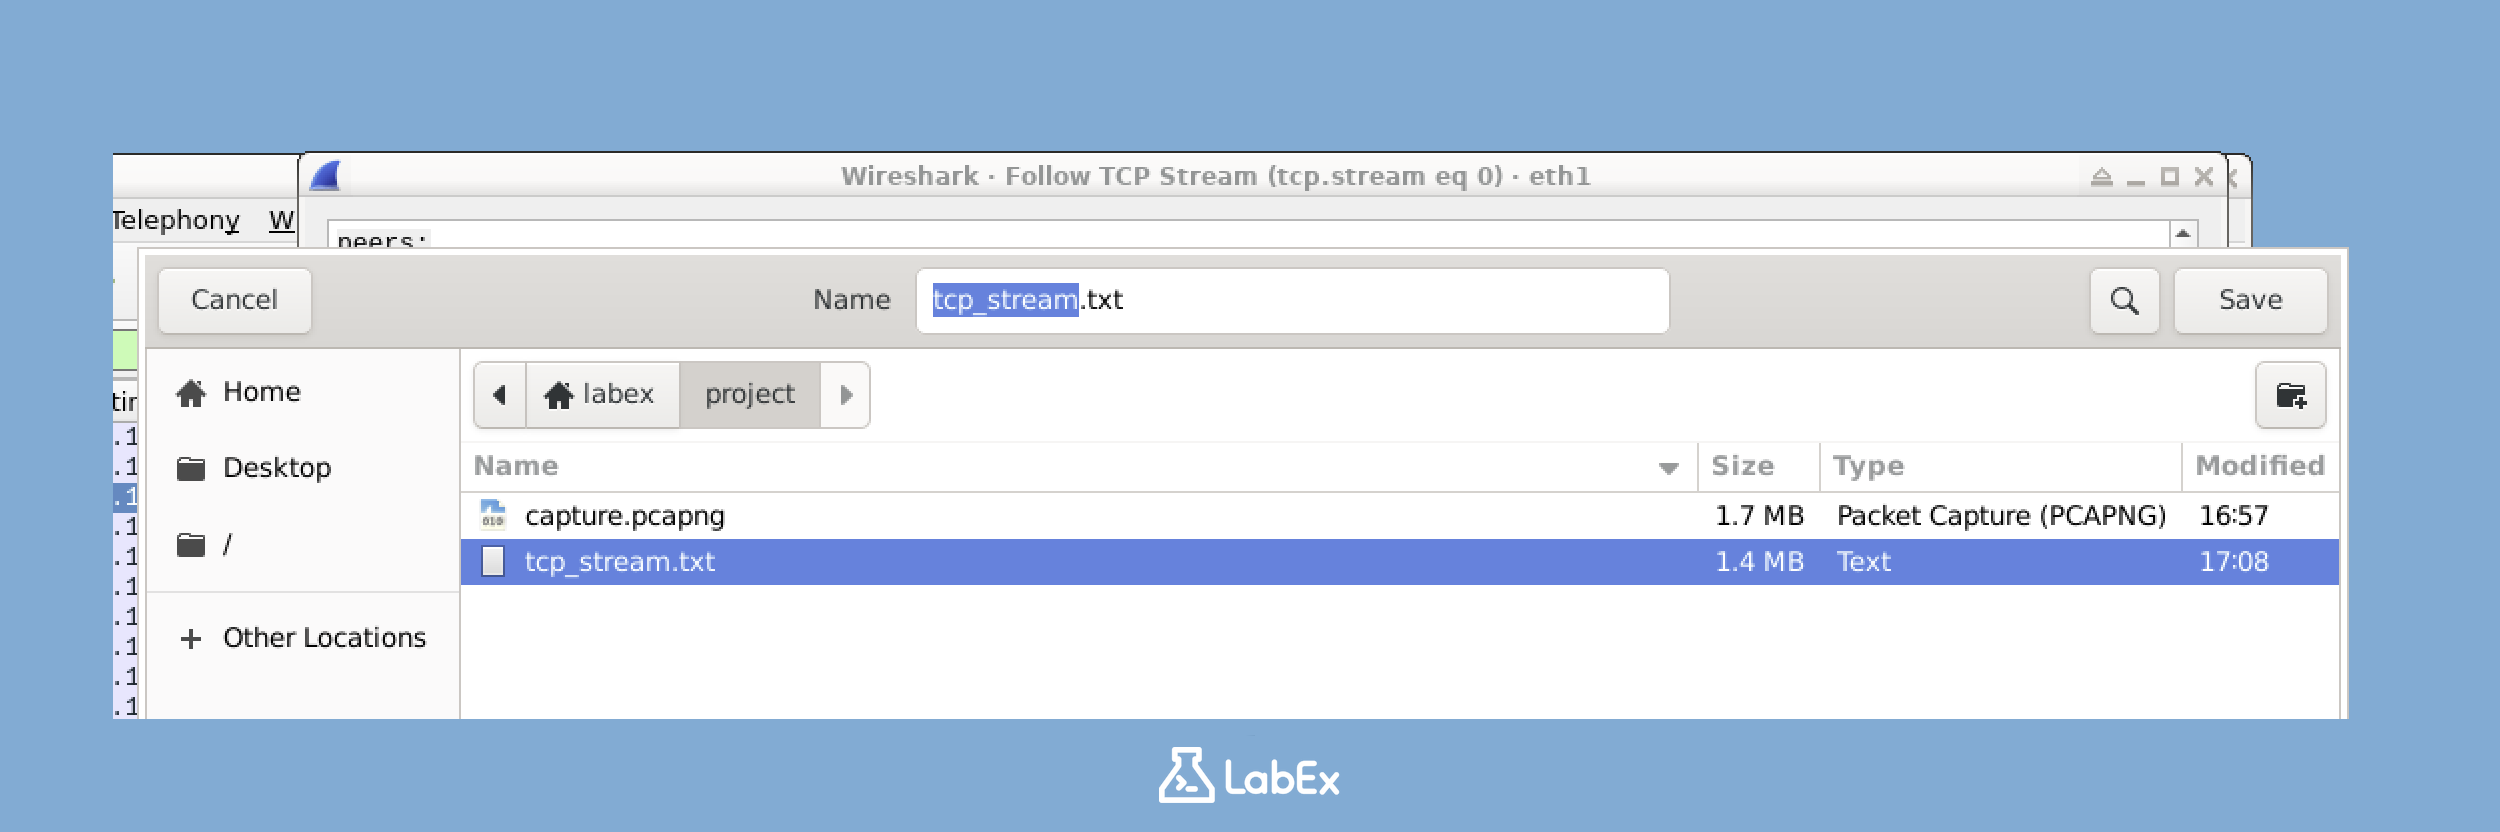
This saved file contains the text of the entire TCP conversation and can be reviewed later or shared with others.
Finding Interesting Streams
In real-world scenarios, captures often contain hundreds or thousands of different TCP streams. To find interesting ones:
- Use display filters to narrow down the scope (e.g.,
httportcp.port == 3001) - Look for key packets (like connection initiations or packets containing specific content)
- Use the "Follow TCP Stream" feature on those packets
You can also filter for a specific stream once you've identified it. In the TCP stream window, note the "Stream index" value (such as "TCP Stream: 5"). You can use the filter tcp.stream eq 5 to show only all packets from that specific stream.
Investigation strategy: When analyzing potential security incidents, pay attention to unusual port numbers, connections to unexpected IP addresses, or communications occurring at unusual times. Following these streams often reveals malicious activity.
Understanding TCP Communication Patterns
As you examine multiple TCP streams, you'll start to recognize patterns in TCP communications:
- Three-way handshake: The SYN, SYN-ACK, ACK sequence that starts a connection
- Data transfer: The main request-response exchanges
- Four-way closure: The FIN and ACK sequences that terminate a connection
By examining these patterns, you can determine where communication problems occur, such as failed connection establishments or premature terminations.
Statistical Analysis Tools
Wireshark offers several statistical tools to help analyze your capture. These tools provide insights into overall network patterns and can help identify unusual activity.
Why Statistical Analysis Matters
While packet-by-packet analysis is essential for deep investigation, statistical analysis helps you:
- Identify major activity patterns on your network
- Discover anomalous traffic or potential issues
- Understand resource usage and network performance
- Identify the most active hosts and services
The big picture: Think of packet analysis as examining individual trees, while statistical analysis gives you a view of the entire forest. Both perspectives are necessary for complete network analysis.
Using Statistical Tools
To access these tools, explore the Statistics menu and try the following options:
Protocol Hierarchy
The Protocol Hierarchy shows the distribution of protocols in your capture:
- Click on
Statistics>Protocol Hierarchy - A window will open showing a tree view of all protocols detected
- The percentages indicate how much of your traffic uses each protocol
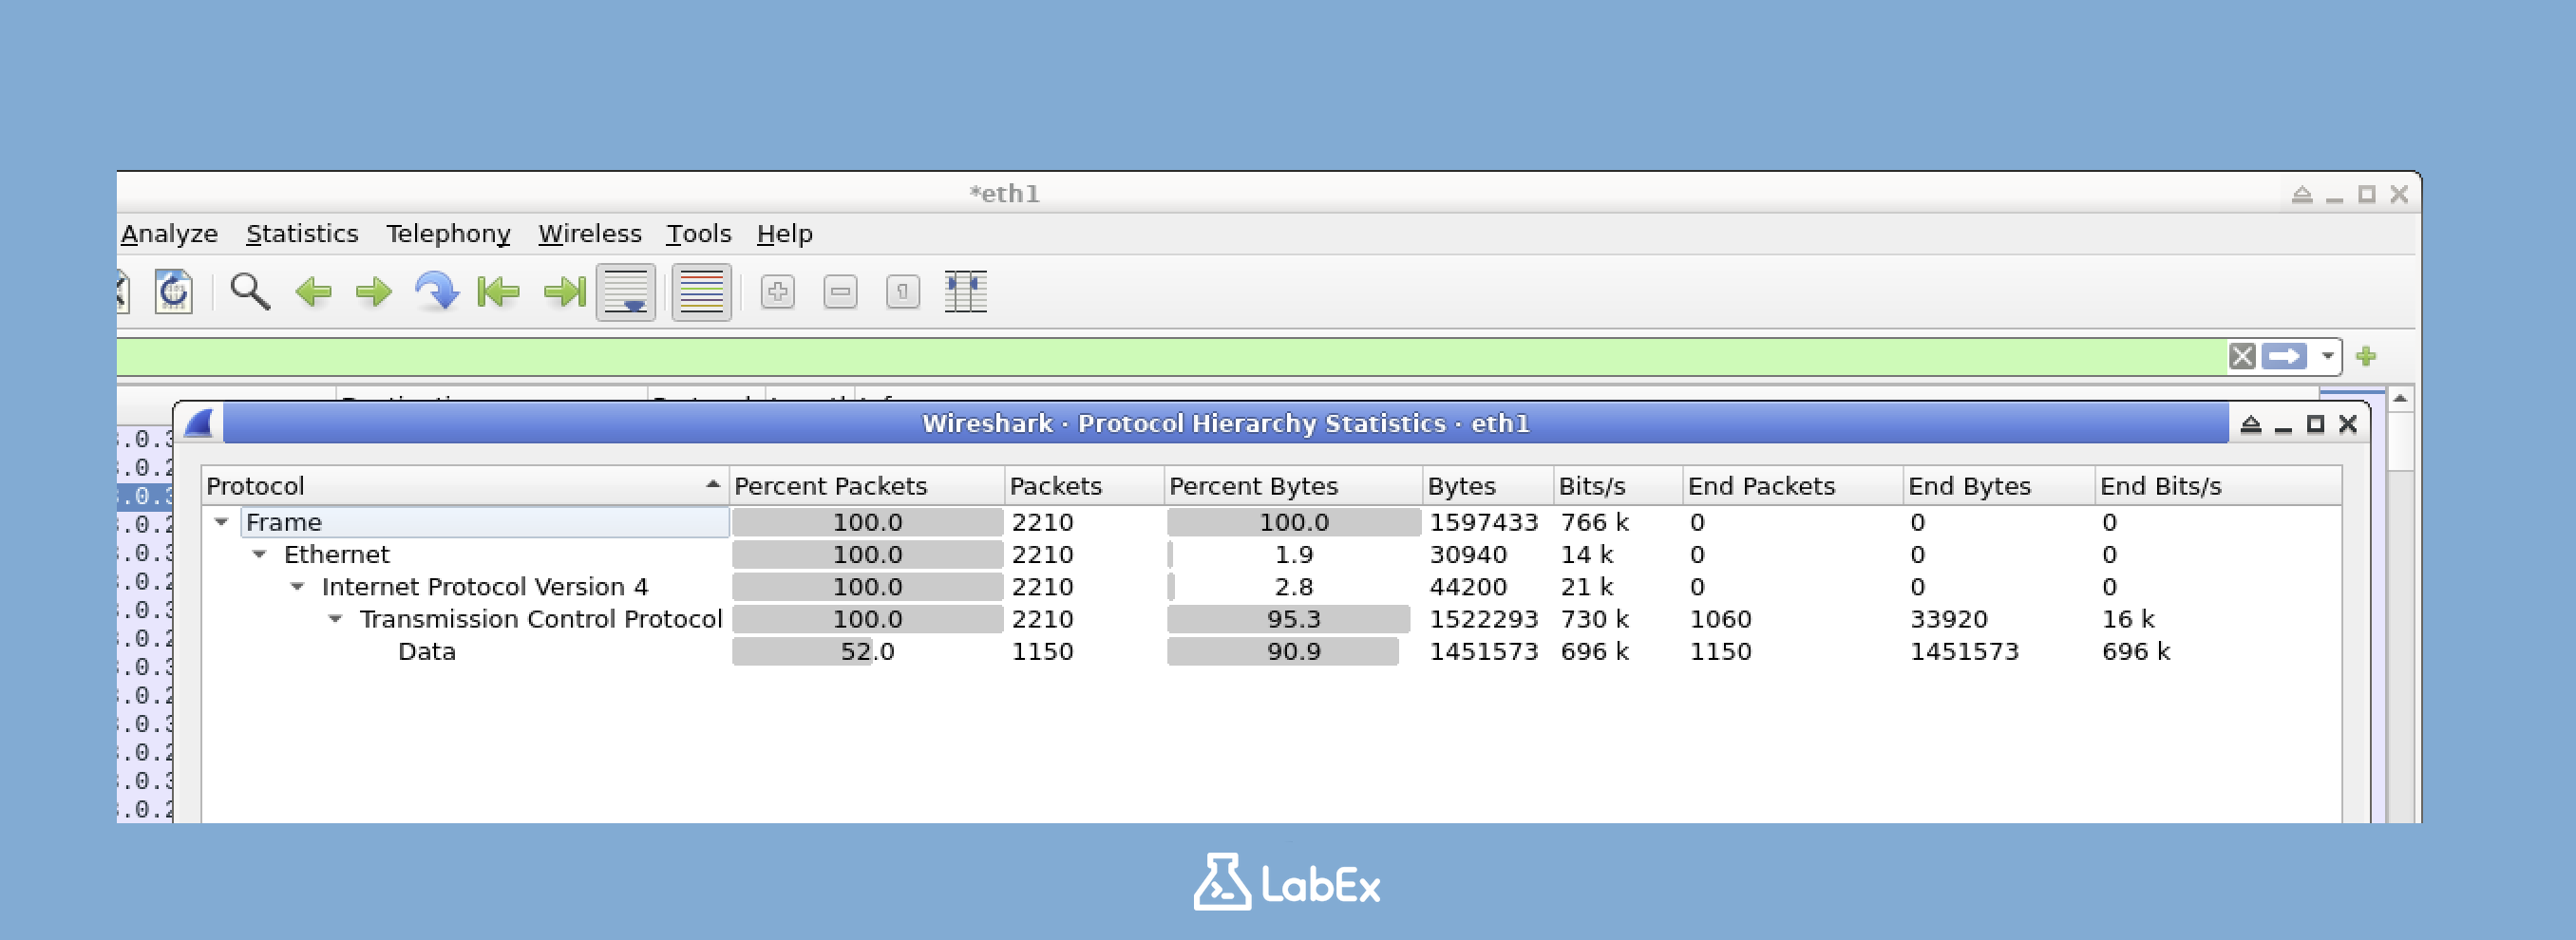
This view helps you quickly identify:
- Which protocols are consuming the most bandwidth
- Unexpected or potentially unwanted network traffic
- The overall composition of your network traffic
Analysis tip: Unusual protocol distributions might indicate network problems or security issues. For example, an abnormally high amount of DNS traffic could suggest DNS tunneling activity or malware communication.
Conversations
The Conversations statistics list all connections between endpoints:
- Click on
Statistics>Conversations - Select the tab for the protocol level you want to examine (Ethernet, IPv4, TCP, etc.)
- The list shows which hosts are communicating and how much data they exchanged
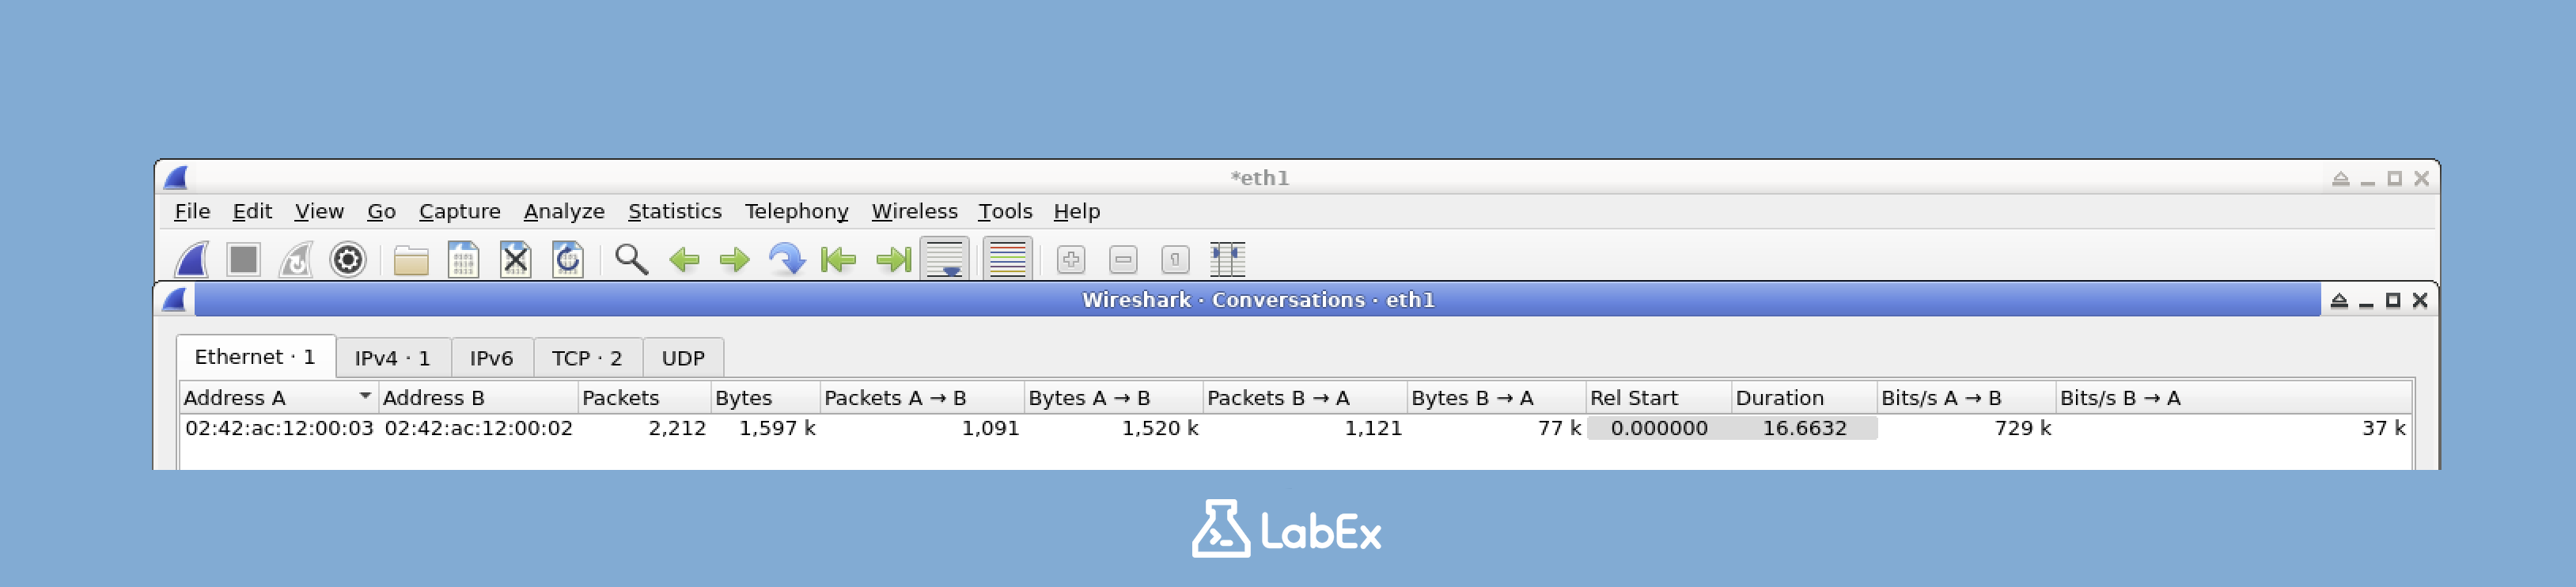
This tool is particularly useful for:
- Identifying which device pairs are exchanging the most data
- Discovering unexpected communications between devices
- Finding potential unauthorized connections
Interactive feature: You can right-click on any conversation and select "Apply as Filter" to show only the packets belonging to that conversation. This makes it easy to investigate specific communications.
Endpoints
The Endpoints statistics list all devices in your capture:
- Click on
Statistics>Endpoints - Select the tab for the protocol level you want to examine
- The list shows all devices involved in the traffic
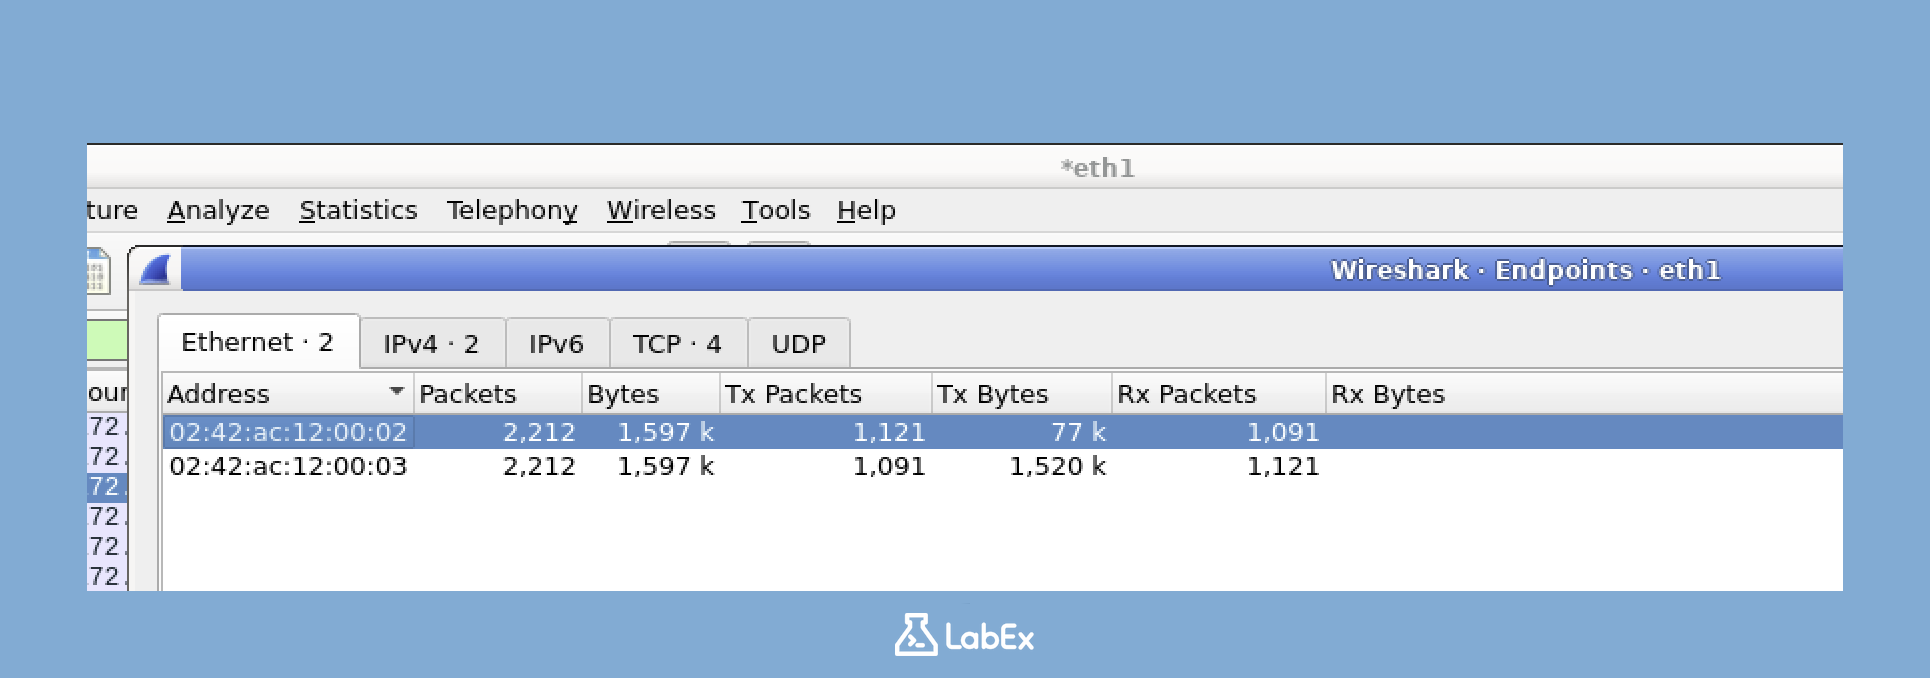
Use this tool to:
- Identify the most active devices on your network
- Find unknown or unexpected devices
- Analyze traffic patterns by IP address or MAC address
Network mapping: The Endpoints tool essentially creates a map of all devices communicating on your network. In security contexts, this helps identify rogue devices or unauthorized systems.
I/O Graph
The I/O Graph displays traffic volume over time:
- Click on
Statistics>I/O Graph - The graph shows how traffic volume changes over the duration of the capture
- You can add multiple graphs with different filters to compare different types of traffic
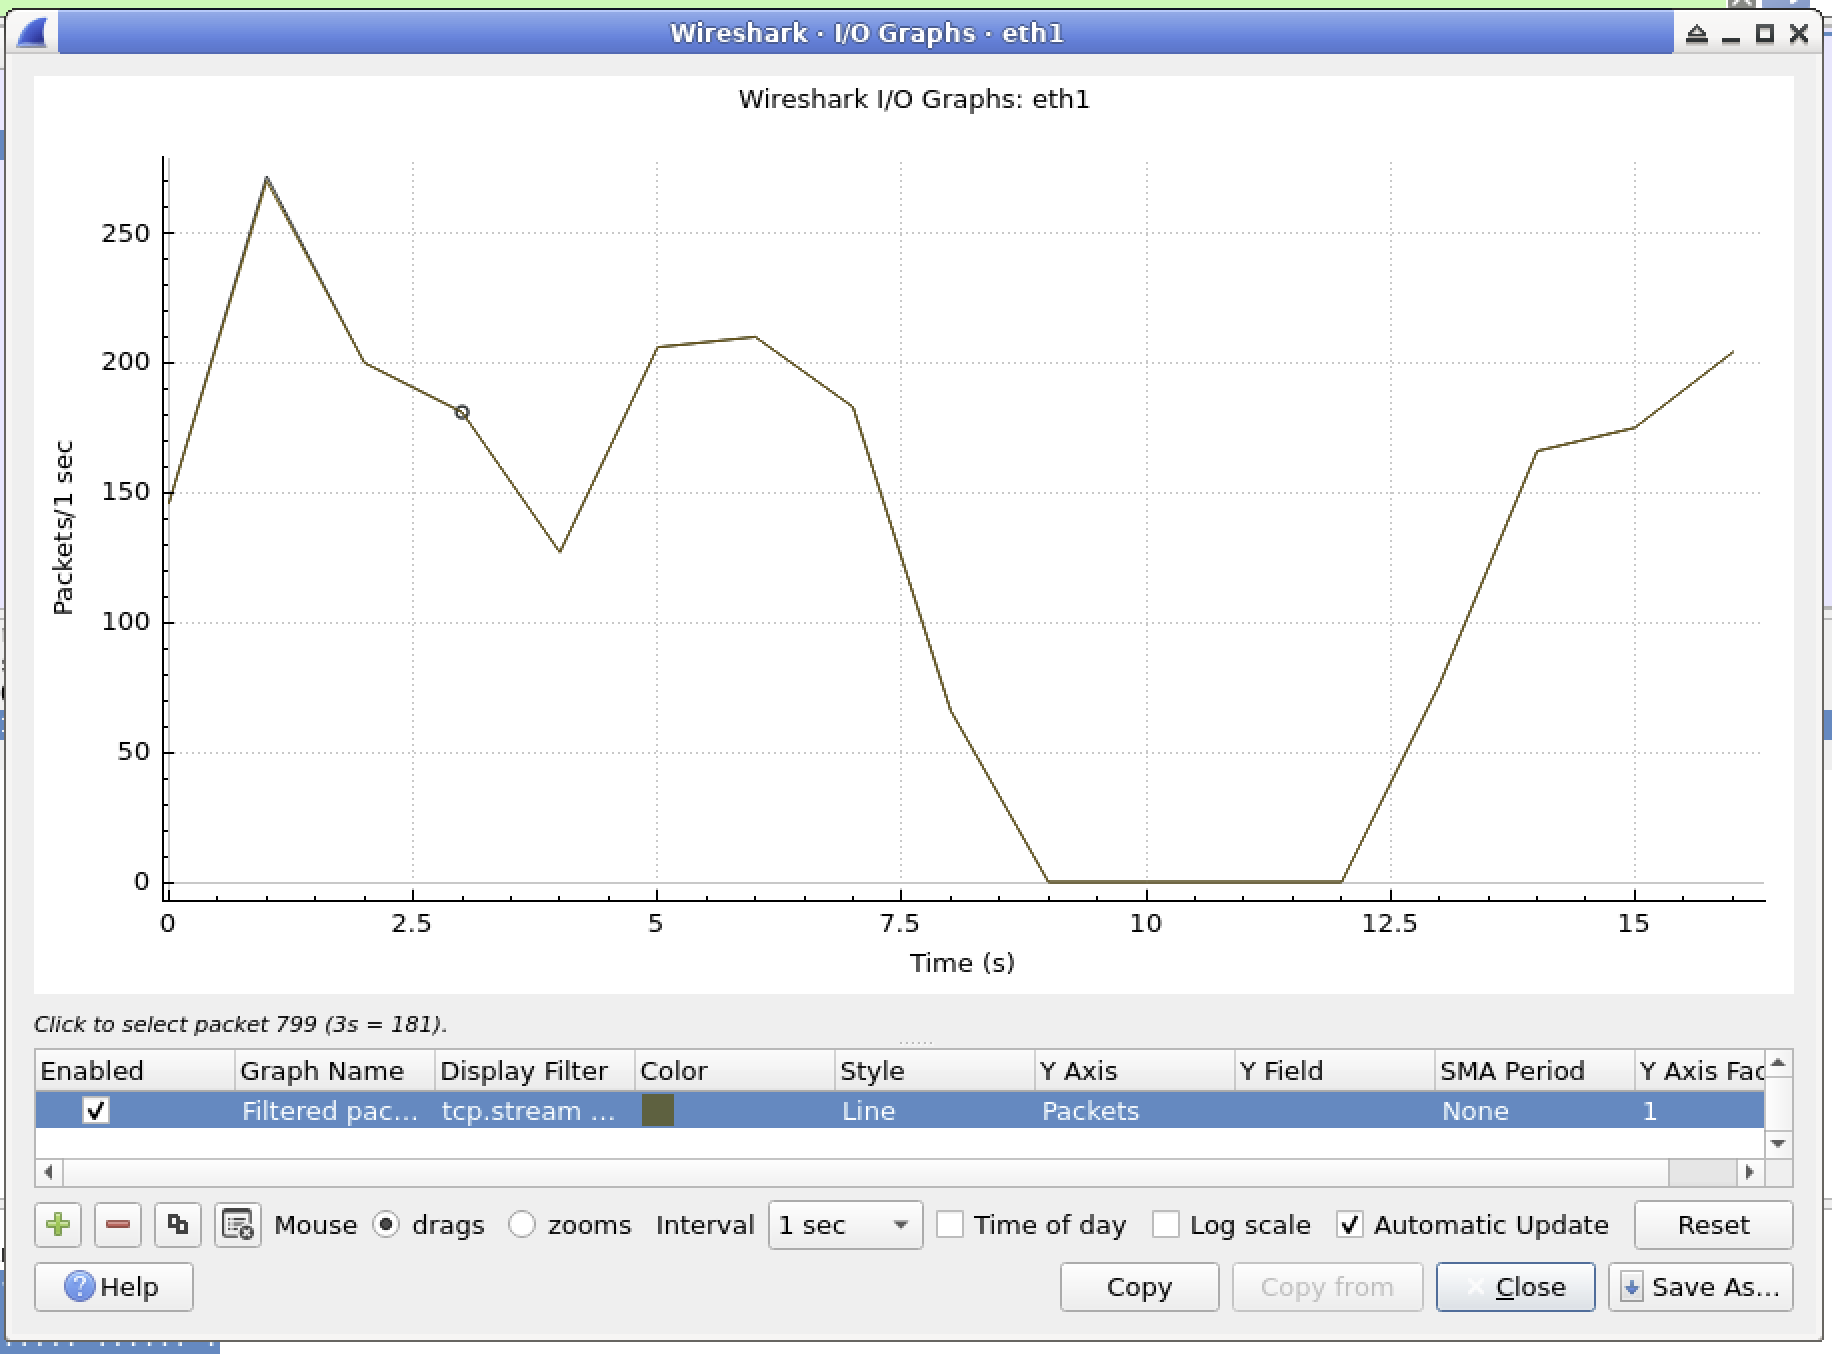
This visualization is excellent for:
- Identifying traffic spikes or unusual patterns
- Correlating network events with time
- Comparing different types of traffic over the same time period
Advanced usage: Click on the "+" button to add additional graph lines with specific display filters. For example, you could have one line showing all traffic, another showing only HTTP traffic, and a third showing DNS traffic. This makes it easy to see relationships between different protocols.
Practical Applications of Statistical Analysis
These statistical tools are particularly valuable in scenarios like:
- Troubleshooting network problems: Identify which applications or devices are consuming excessive bandwidth
- Security monitoring: Detect unusual traffic patterns that might indicate intrusions or malware
- Network baseline: Establish normal traffic patterns to help identify future anomalies
- Performance optimization: Determine which protocols or connections are dominating network usage
Advanced Statistical Features
As you become more comfortable with Wireshark, explore these additional statistical features:
- Service Response Time: Measures how long services take to respond to requests
- HTTP Statistics: Provides detailed breakdown of HTTP traffic and performance
- DNS Statistics: Shows DNS query and response patterns
- Expert Information: Highlights potential issues or anomalies detected by Wireshark
These advanced statistics provide deeper insights for specialized analysis tasks.
Congratulations! You have now learned the basics of analyzing network traffic with Wireshark. These skills form a foundation for more advanced network analysis and cybersecurity investigations.
Summary
In this lab, you have learned the essential skills for capturing and analyzing network traffic using Wireshark. First, you installed Wireshark and set up the required permissions for packet capture. Then, you captured live network traffic from your system and saved it for further analysis. Finally, you explored various analysis techniques such as display filters, coloring rules, and following TCP streams.
The skills you've acquired are fundamental for network troubleshooting and cybersecurity investigations. Network traffic analysis enables you to identify security threats, troubleshoot network and application issues, understand protocol functions in detail, and monitor network performance. As you progress in your cybersecurity journey, you can build on these basics to develop more advanced packet analysis techniques, including malware detection, intrusion detection, and network forensics.

