Introduction
In this project, you will learn how to create a line chart using the ECharts library. The chart will display the number of hours the user spends on their phone each day of the week.
👀 Preview
🎯 Tasks
In this project, you will learn:
- How to set up the project and open the necessary files
- How to fix an error in the ECharts configuration
- How to understand the configuration of the line chart
- How to customize the chart by modifying the configuration
🏆 Achievements
After completing this project, you will be able to:
- Use the ECharts library to create a line chart
- Configure the chart's title, axes, and data series
- Customize the chart by modifying the configuration
Set Up the Project
In this step, you will set up the project and open the files in the editor.
- Open the editor on the right. You should see two files —
index.htmlandecharts.js. - Click on Go Live button in the bottom right corner of WebIDE, to run the project.
- Open "Web 8080" on the top of the VM and manually refresh it to see the page.
Fix the Error in the index.html File
In this step, you will fix the error in the index.html file.
- Locate the
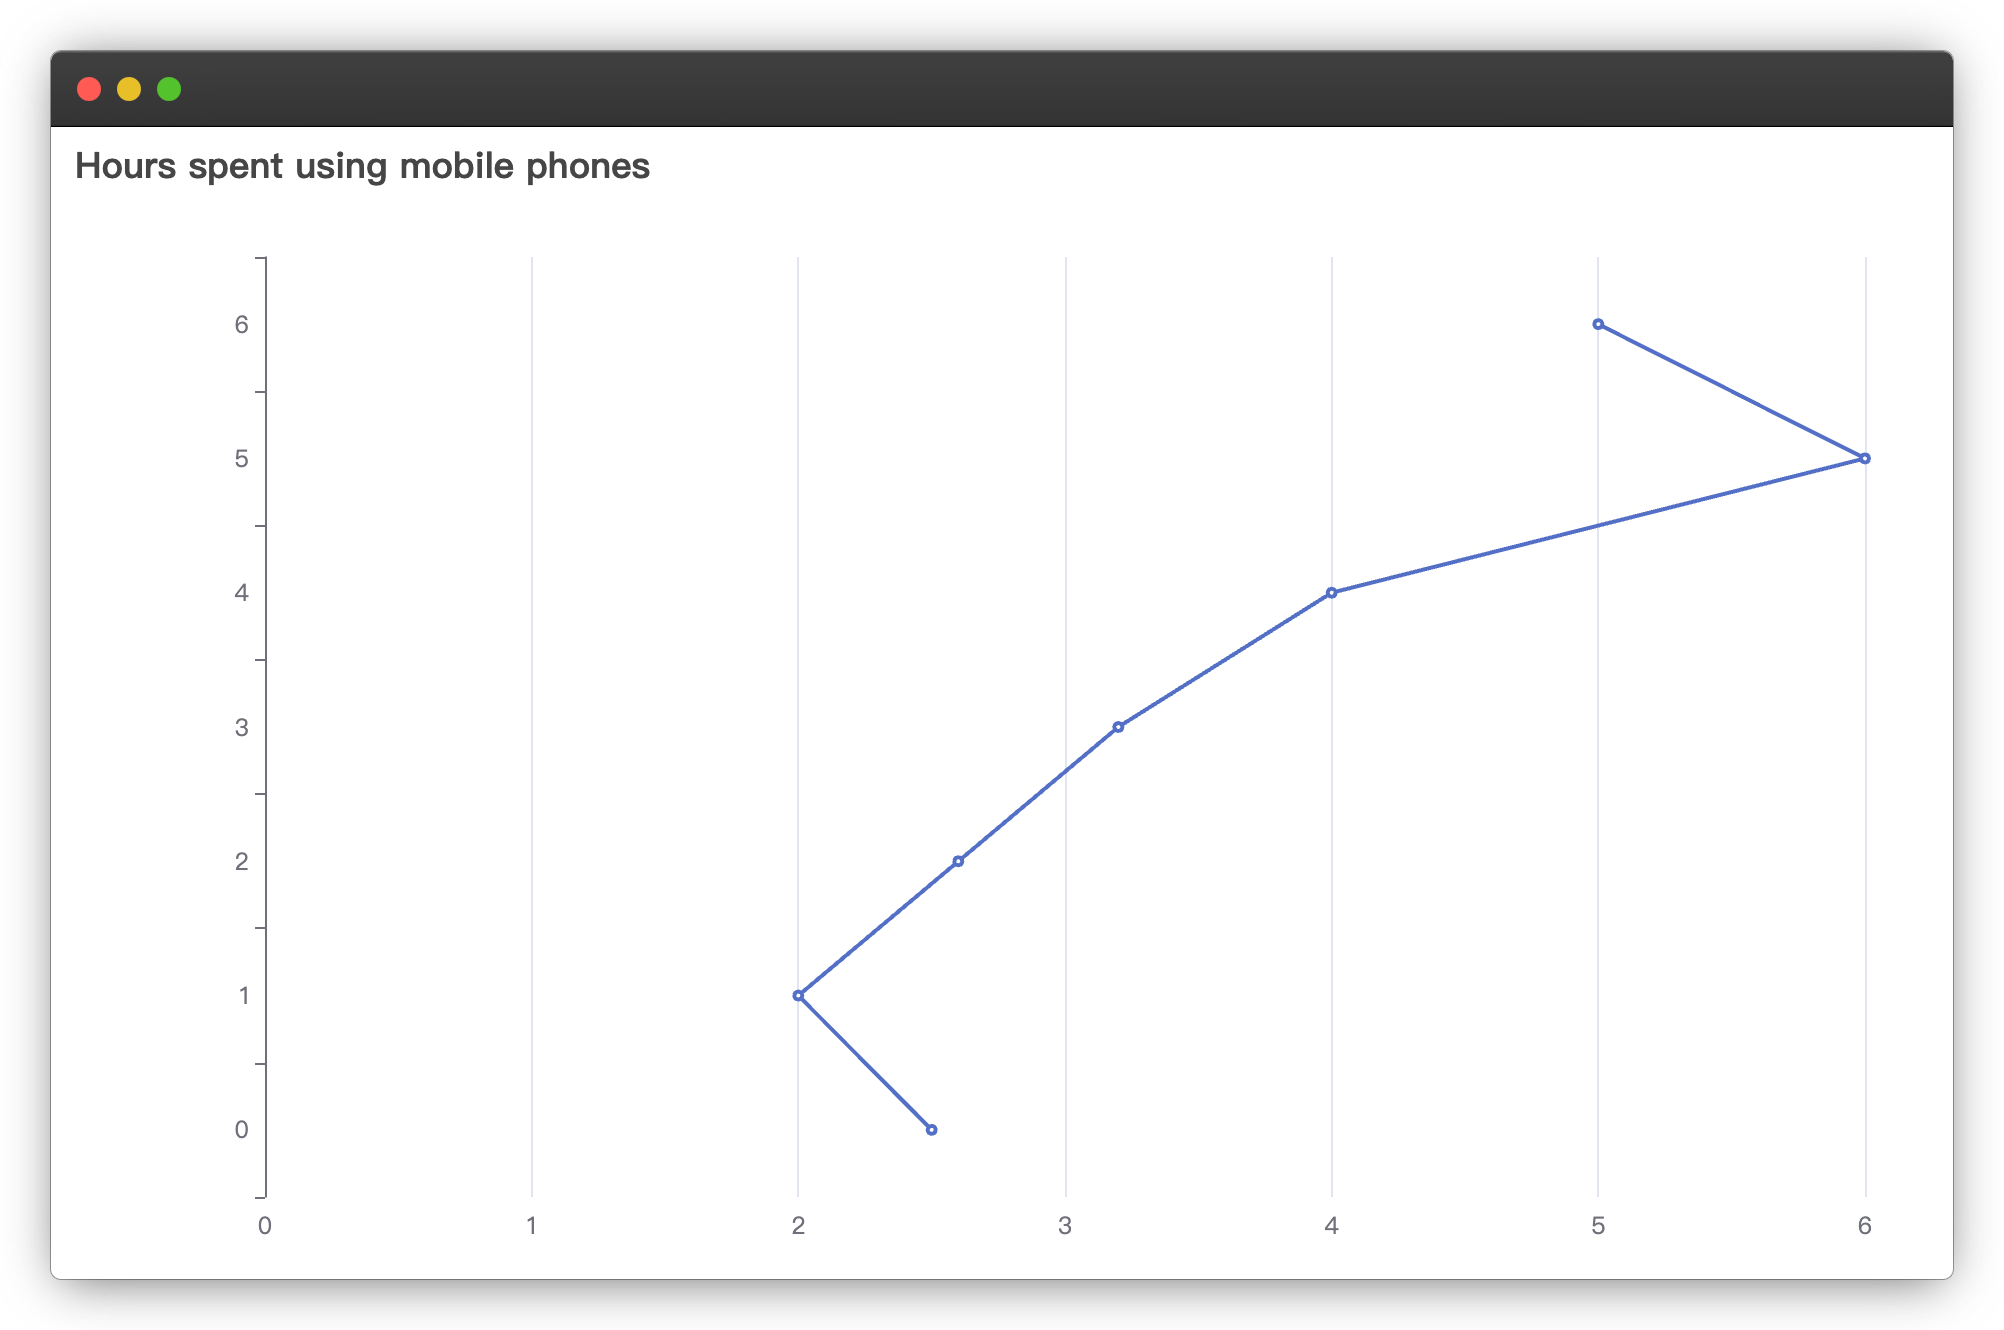
var option = {}section in theindex.htmlfile. - There is a bug in the configuration item that causes the axes to be displayed incorrectly.
- Update the
optionobject to the following:
var option = {
title: {
text: "Hours spent using mobile phones"
},
xAxis: {
type: "category",
data: [
"Monday",
"Tuesday",
"Wednesday",
"Thursday",
"Friday",
"Saturday",
"Sunday"
]
},
yAxis: {
type: "value"
},
series: [
{
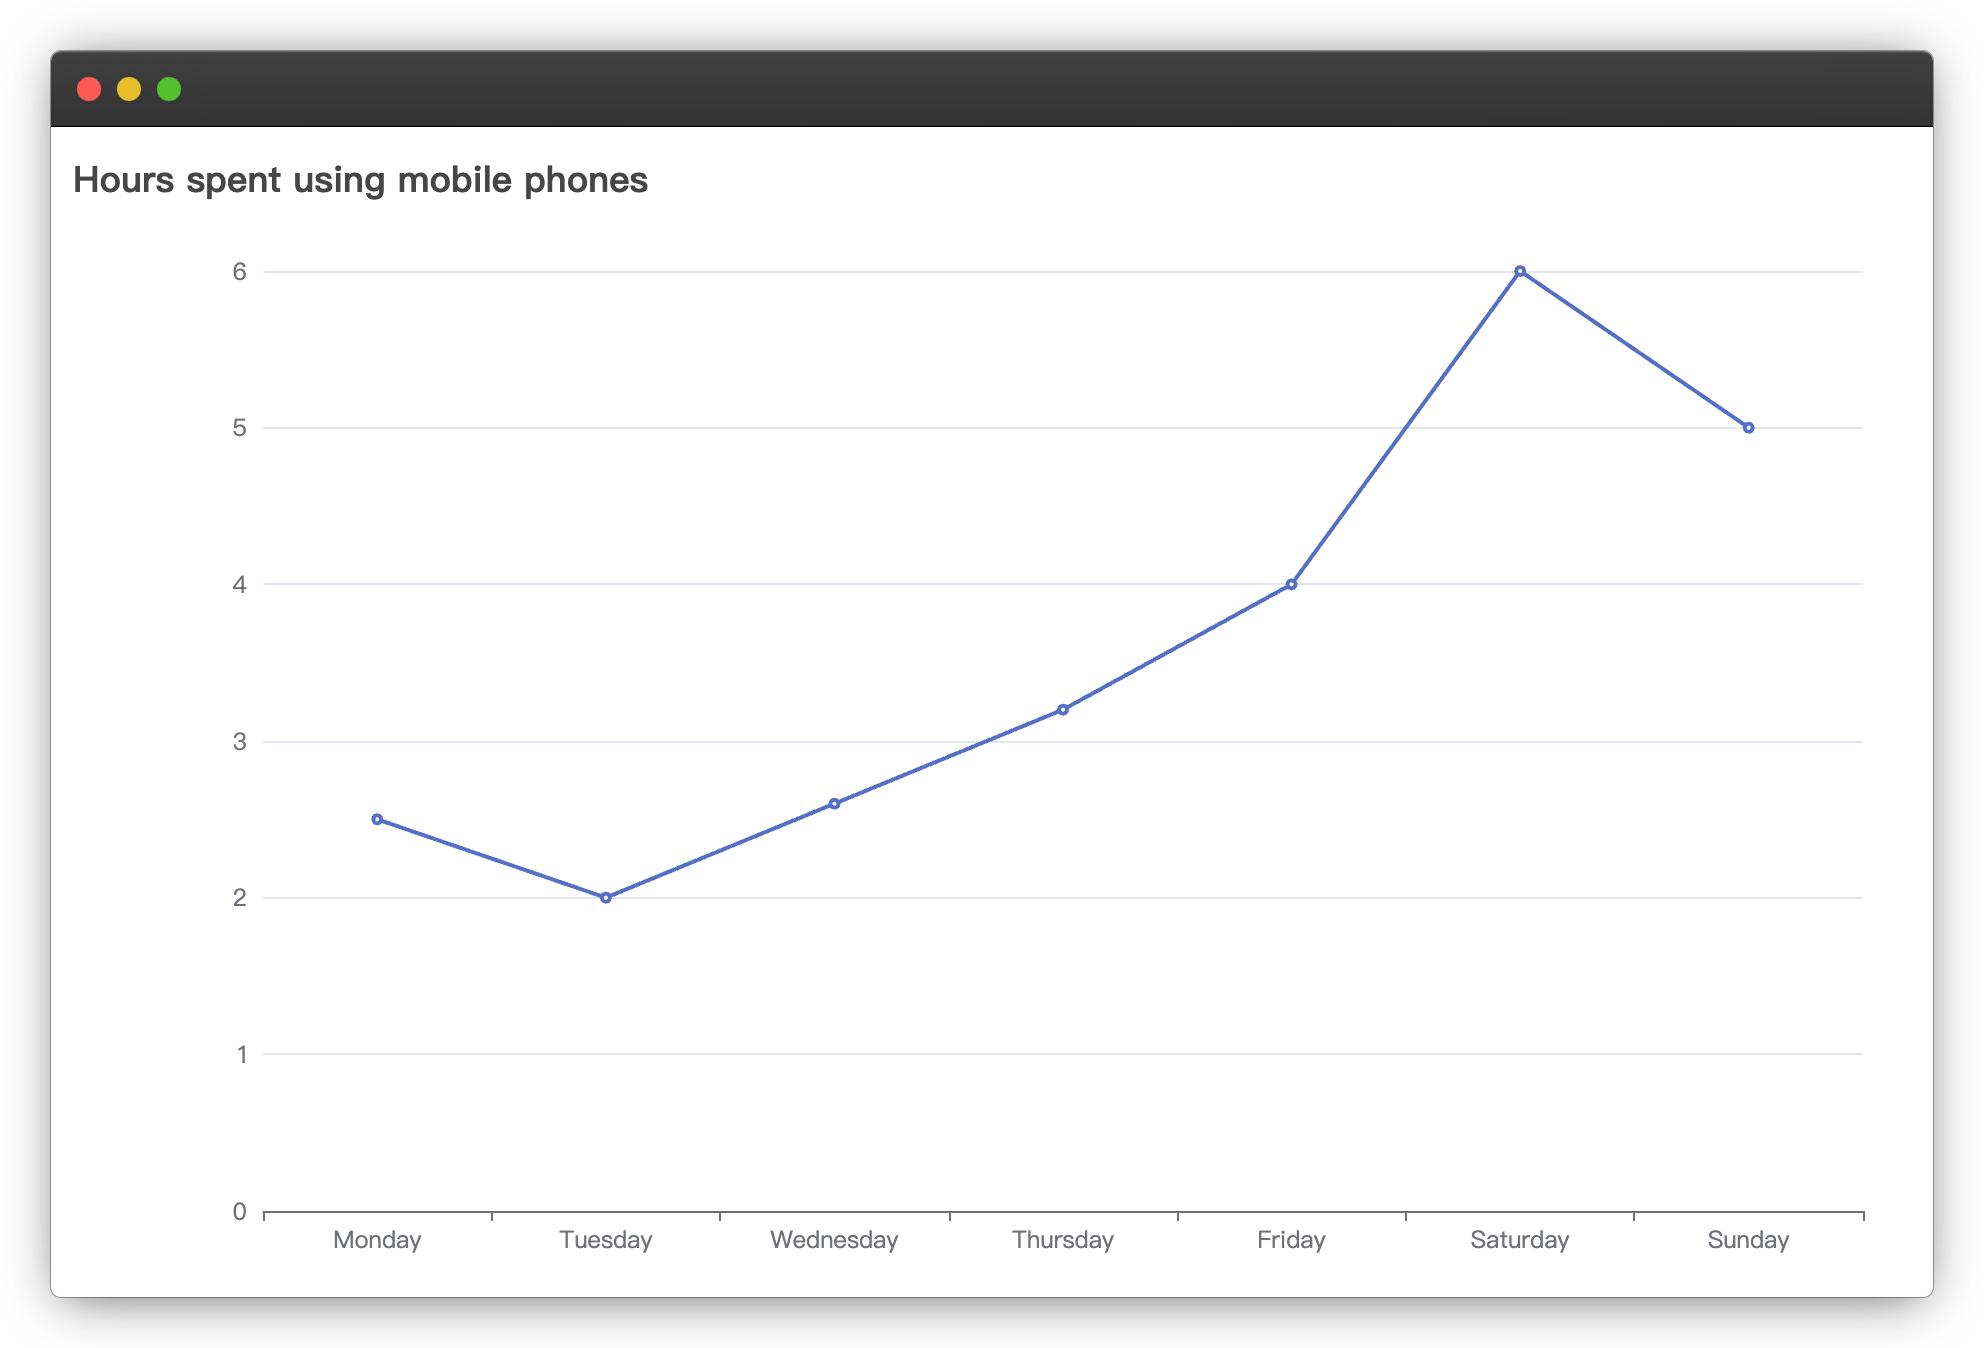
data: [2.5, 2, 2.6, 3.2, 4, 6, 5],
type: "line"
}
]
};
- Understand the code above:
- The
titleproperty sets the title of the line chart. - The
xAxisproperty configures the x-axis, which is set to "category" type and displays the days of the week. - The
yAxisproperty configures the y-axis, which is set to "value" type. - The
seriesproperty is the series wheredatais the time data for each day of the week that the phone is used, andtypeis the type of chart as a line chart.
- Save the file and reload the page to see the updated chart. The finished result is as follows:
Summary
Congratulations! You have completed this project. You can practice more labs in LabEx to improve your skills.