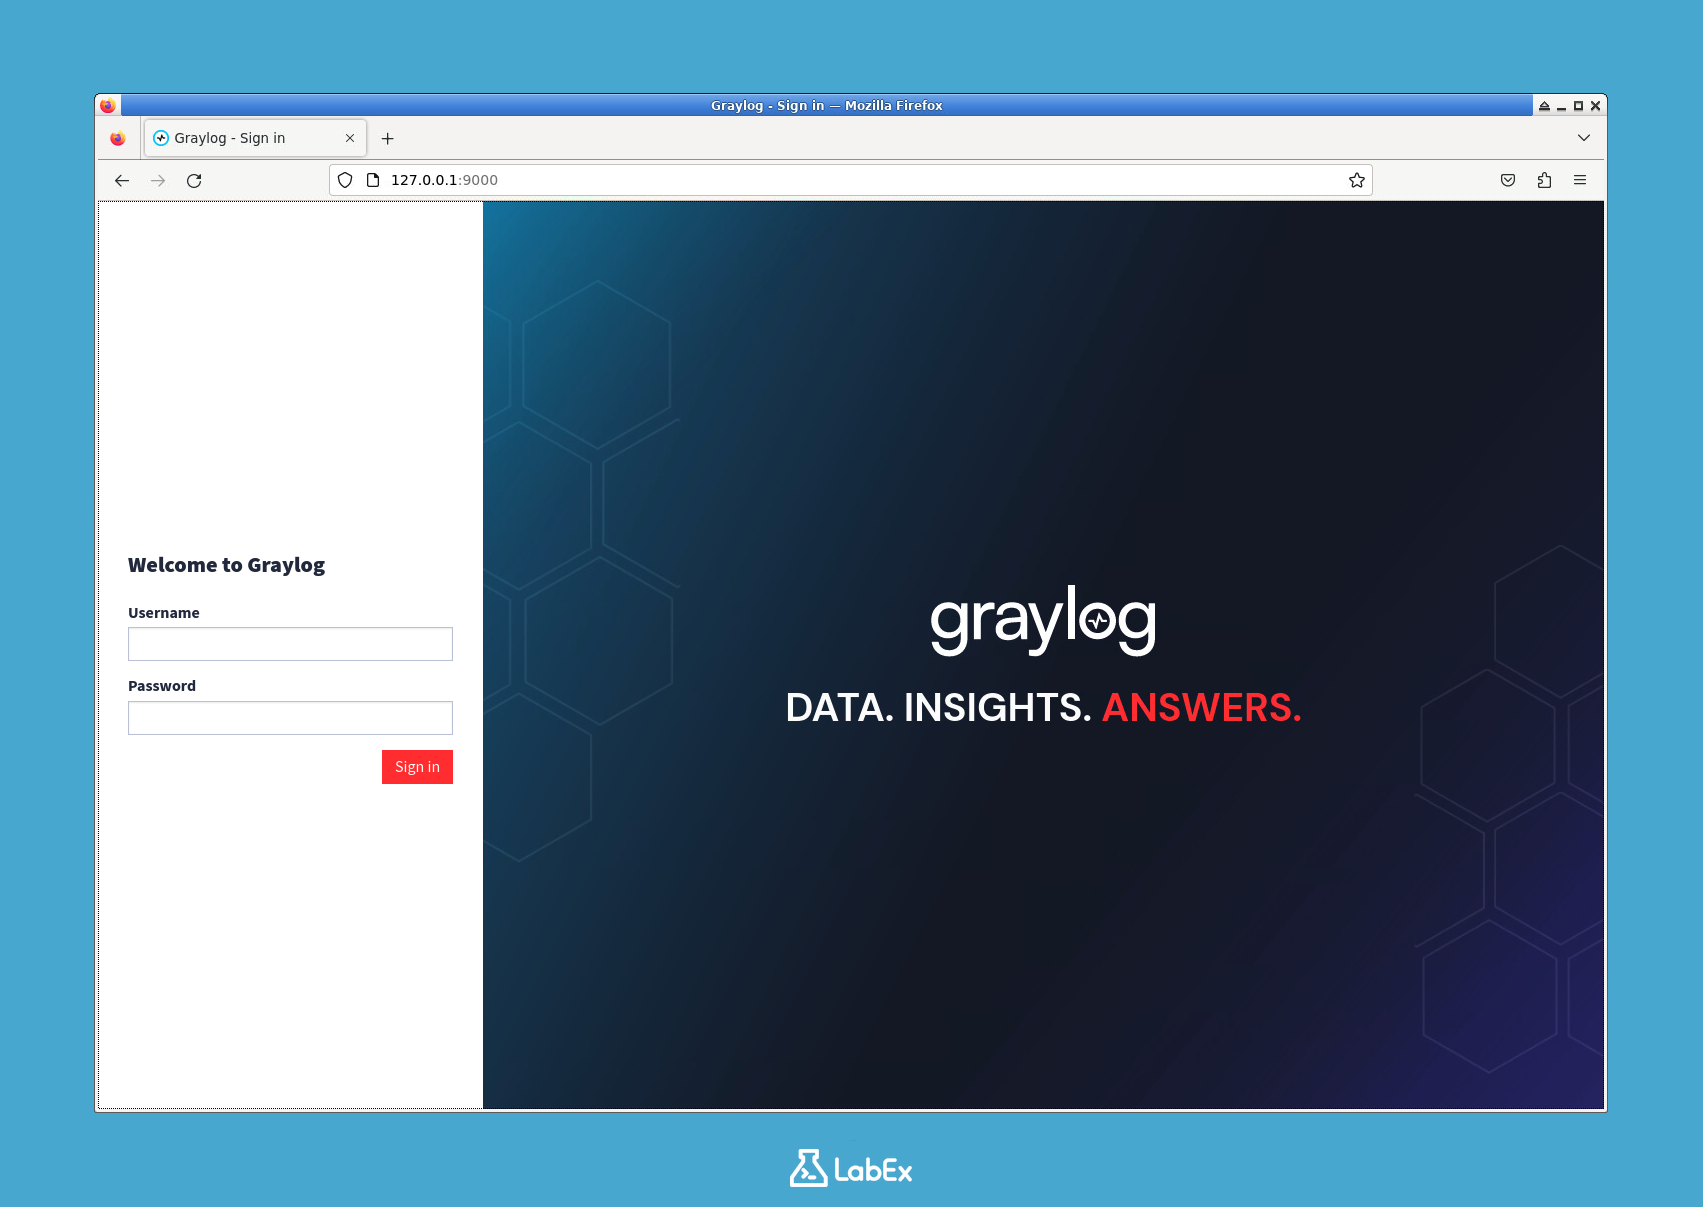
Analyze Logs in Graylog

Beginner
Practice Now

Introduction

In this lab, you will learn how to analyze logs using Graylog, an open-source log management platform for cybersecurity monitoring. You'll practice setting up Graylog with Docker Compose, configuring log inputs, and performing log analysis through practical exercises.

The lab guides you through deploying Graylog alongside MongoDB and Elasticsearch, then using its web interface to collect and query log data. These hands-on tasks will help you gain essential skills for centralized log management and security monitoring.


Skills Graph

Install Graylog

In this step, you will install Graylog, a powerful open-source log management platform, in your LabEx VM environment. Graylog helps centralize and analyze log data for security monitoring and troubleshooting by collecting logs from various sources and providing search and visualization capabilities.

Since we're using Docker containers, we'll deploy Graylog using Docker Compose for easy setup. Docker Compose allows us to define and run multi-container applications with a single configuration file. This approach simplifies the installation process and ensures all required components work together properly. Follow these steps carefully:

  1. First, ensure you're in the correct directory. The project directory is where we'll organize our Graylog installation files:
cd ~/project
  1. Create a new dedicated directory for Graylog configuration. This keeps our installation files separate and organized:
mkdir graylog && cd graylog
  1. Create a docker-compose.yml file with the following content using nano. This file defines all the services Graylog needs to run:
nano docker-compose.yml
  1. Paste this configuration (press Ctrl+O to save, then Ctrl+X to exit). The configuration includes three main services:
    • MongoDB for storing configuration data
    • Elasticsearch for indexing and searching logs
    • Graylog itself as the web interface and processing engine
version: "3"
services:
  mongodb:
    image: mongo:4.2
    volumes:
      - mongo_data:/data/db
  elasticsearch:
    image: docker.elastic.co/elasticsearch/elasticsearch-oss:7.10.2
    volumes:
      - es_data:/usr/share/elasticsearch/data
    environment:
      - "discovery.type=single-node"
      - "bootstrap.memory_lock=true"
      - "ES_JAVA_OPTS=-Xms512m -Xmx512m"
  graylog:
    image: graylog/graylog:4.3
    volumes:
      - graylog_data:/usr/share/graylog/data
    environment:
      - GRAYLOG_PASSWORD_SECRET=somepasswordpepper
      - GRAYLOG_ROOT_PASSWORD_SHA2=8c6976e5b5410415bde908bd4dee15dfb167a9c873fc4bb8a81f6f2ab448a918
      - GRAYLOG_HTTP_EXTERNAL_URI=http://127.0.0.1:9000/
    depends_on:
      - mongodb
      - elasticsearch
    ports:
      - "9000:9000"
      - "1514:1514"
      - "1514:1514/udp"
      - "12201:12201"
      - "12201:12201/udp"
volumes:
  mongo_data:
  es_data:
  graylog_data:
  1. Start the Graylog stack with Docker Compose. The -d flag runs containers in the background:
docker-compose up -d
  1. Verify the containers are running properly. This command shows the status of all services defined in our docker-compose file:
docker-compose ps

You should see three services (mongodb, elasticsearch, and graylog) with status "Up". The Graylog web interface will be available at http://127.0.0.1:9000 (username: admin, password: admin). This completes the basic Graylog installation, and we're now ready to configure log inputs in the next steps.

Set Up a Log Input

In this step, you will configure a log input in Graylog to receive syslog messages. Think of this as creating a "listening port" where Graylog can collect log data from various devices and applications. This is essential for security monitoring because logs contain valuable information about system activities and potential threats.

  1. First, let's verify Graylog is running properly from our previous setup. Run this command to check the container status:
cd ~/project/graylog
docker-compose ps
  1. Access the Graylog web interface by opening your browser and navigating to http://127.0.0.1:9000. Use these credentials:

    • Username: admin
    • Password: admin
  2. In the Graylog web interface, we'll create a new input source:

    • Click on "System" in the top menu - this is where we manage Graylog's core functions
    • Select "Inputs" from the dropdown - inputs are how Graylog receives log data
    • Under "Select input" choose "Syslog UDP" - UDP is faster for log collection than TCP
    • Click "Launch new input" to start the configuration
  3. Now configure the input with these specific settings:

    • Node: Select your Graylog server (this should be the only option available)
    • Title: "Syslog UDP Input" (give it a descriptive name)
    • Bind address: 0.0.0.0 (means listen on all network interfaces)
    • Port: 1514 (standard syslog port alternative)
    • Click "Save" to activate the input
  4. After saving, verify the input is working properly:

    • Look for a green "Running" status next to your new input - this means it's active
    • The "Local inputs" section should now show "1 input running" - confirming successful setup
  5. Let's test our new input by sending a sample log message. Run this command in your terminal:

echo "<14>$(date +'%b %d %H:%M:%S') localhost labex: Test syslog message" | nc -w1 -u 127.0.0.1 1514

This command creates a test log message with priority level 14 (info) and sends it to Graylog using netcat (nc). The message includes the current date/time and identifies the source as "localhost".

You've now successfully set up Graylog to receive syslog messages. In the next steps, we'll explore how to send more complex logs and search through them to find important security information.

Send Sample Logs

In this step, you will generate and send sample log messages to Graylog through the syslog input you configured earlier. This practical exercise helps verify your logging pipeline is working correctly before analyzing real-world data. We'll create test logs that simulate different severity levels and application types, which is essential for understanding how Graylog processes and categorizes log entries.

  1. First, ensure your Graylog containers are running. This command checks the status of your Docker containers - they should show "Up" status if everything is working properly:
cd ~/project/graylog
docker-compose ps
  1. We'll create a simple bash script to generate sample logs. The script will produce structured log messages that include timestamps, severity levels, and application names. Create a new file in your project directory:
nano ~/project/generate_logs.sh
  1. Add the following content to the file. This script does several important things:
    • Generates 10 log messages with random severity levels (0-7)
    • Includes proper timestamps in syslog format
    • Uses the 'nc' command to send logs via UDP to port 1514
    • Adds a 1-second delay between messages for better visualization:
#!/bin/bash
for i in {1..10}; do
  severity=$(((RANDOM % 8)))
  timestamp=$(date +'%b %d %H:%M:%S')
  echo "<$((severity + 8))>$timestamp localhost sample_app[$i]: Sample log message $i with severity $severity" | nc -w1 -u 127.0.0.1 1514
  sleep 1
done
  1. Make the script executable so you can run it directly. The chmod command changes the file permissions:
chmod +x ~/project/generate_logs.sh
  1. Execute the script to send sample logs to Graylog. You won't see direct output in the terminal because the logs are being sent to Graylog's syslog input:
~/project/generate_logs.sh
  1. Now let's verify the logs arrived in Graylog. Follow these steps in the web interface:

    • Open your browser and go to http://127.0.0.1:9000
    • Click on "Search" in the top menu to view incoming messages
    • Your sample logs should appear within a few seconds
    • Try searching for "sample_app" to filter and view only your test logs
  2. (Optional) For more comprehensive testing, you can send additional log messages that simulate common server applications. These examples show different log formats that Graylog can process:

## Apache-style web server log
echo '<13>$(date +"%b %d %H:%M:%S") localhost apache: 127.0.0.1 - - [$(date +"%d/%b/%Y:%H:%M:%S %z")] "GET / HTTP/1.1" 200 45' | nc -w1 -u 127.0.0.1 1514

## SSH login attempt (common security event)
echo '<12>$(date +"%b %d %H:%M:%S") localhost sshd[1234]: Failed password for root from 192.168.1.100 port 22 ssh2' | nc -w1 -u 127.0.0.1 1514

Query Log Data

In this step, we'll explore how to search and analyze log data in Graylog using its query language. Graylog's search functionality helps you quickly find relevant logs among large volumes of data. We'll use the sample logs you sent earlier to practice these techniques.

  1. First, access the Graylog web interface at http://127.0.0.1:9000 (username: admin, password: admin). This is where all log analysis happens in Graylog.

  2. Basic search operations:

    • Click on "Search" in the top menu to access the search interface
    • In the search bar, enter source:localhost to see all logs from our test source. This demonstrates how to filter logs by their source field.
    • Try these basic queries to understand different search patterns:
      message:"Sample log message"  ## Finds logs containing exact phrase
      severity:3                   ## Filters by severity level 3
      source:localhost AND severity:[2 TO 4]  ## Combines conditions
  3. Time range filtering:

    • Click the time range selector (default is "Last 5 minutes"). Logs are time-sensitive, so this helps focus on relevant time periods.
    • Change to "Last 15 minutes" to see all your test logs since they were recently sent
    • Try "Absolute" time range to specify exact start/end times when you need precise time windows
  4. Field analysis:

    • Click on any log message to see its fields. Each log contains multiple fields with different information.
    • Note the automatically extracted fields like source, severity, etc. These are created when Graylog processes the logs.
    • Click the "Quick values" tab to see value distributions - this shows which values appear most frequently in your logs.
  5. Save a search:

    • After running a useful query, click "Save search". This is helpful when you need to reuse the same search later.
    • Name it "Sample Log Analysis" for easy identification
    • This will appear in your "Saved searches" section for future access
  6. Create a search query shortcut:

    • Click "Search" → "Edit search shortcuts". Shortcuts save time when you frequently use certain filters.
    • Add a new shortcut named "High Severity" with query severity:[4 TO 7]
    • Now you can quickly access this filtered view from the search dropdown
  7. (Optional) Try these advanced queries to explore more complex search patterns:

    _exists_:severity AND severity:>3  ## Logs that have severity field with value >3
    message:/(sample|test)/i           ## Regex search (case insensitive)
    NOT severity:5                     ## Exclude severity 5 logs

Build a Dashboard

In this final step, you'll create a Graylog dashboard to visualize and analyze the log data you've collected. Dashboards are powerful tools that help security analysts monitor system activity at a glance, identify patterns, and spot potential security issues quickly.

Let's start by accessing the Graylog web interface where we'll build our dashboard:

  1. Access Graylog web interface at http://127.0.0.1:9000 (username: admin, password: admin)

  2. Create a new dashboard:

    • Click "Dashboards" in the top menu - this is where all your dashboards are managed
    • Click "Create dashboard" - we're starting fresh with a new visualization
    • Name it "Security Monitoring Dashboard" - choose a descriptive name that reflects its purpose
    • Click "Create" - this initializes your empty dashboard
  3. Add widgets to your dashboard. Widgets are individual components that display specific data visualizations:

    a. Message Count Chart (shows how many logs are coming in over time):

    • Click "Add widget" → "Message Count"
    • Configure with:
      • Title: "Log Volume" - names the widget for easy reference
      • Time range: "Last 15 minutes" - shows recent activity
      • Interval: "Minute" - groups data by minute for clear trends
    • Click "Save"

    b. Quick Values (displays the most common values in a field):

    • Click "Add widget" → "Quick Values"
    • Configure with:
      • Title: "Top Sources" - shows which systems are generating logs
      • Field: "source" - the log field containing origin information
      • Show data as: "Pie chart" - visualizes proportions clearly
    • Click "Save"

    c. Field Statistics (summarizes numerical data):

    • Click "Add widget" → "Field Statistics"
    • Configure with:
      • Title: "Severity Levels" - monitors how serious the logged events are
      • Field: "severity" - the field containing severity ratings
      • Show data as: "Bar chart" - compares values side-by-side
    • Click "Save"
  4. Arrange your dashboard for optimal visibility:

    • Drag and drop widgets to organize them - place related widgets near each other
    • Resize widgets by dragging their edges - make important visualizations larger
    • Click "Done editing" when finished - locks your layout
  5. Save your dashboard:

    • Click "Save dashboard" in the top right - preserves your work
    • Add description: "Dashboard for monitoring security logs" - explains its purpose
    • Click "Save"
  6. (Optional) Set as default for convenience:

    • Click the star icon next to your dashboard name
    • This will make it your default view when logging in, saving you time during daily checks

Summary

In this lab, you have learned how to deploy Graylog using Docker Compose, configuring essential services like MongoDB and Elasticsearch with persistent storage. You successfully launched the stack, accessed the web interface, and verified container functionality to establish a centralized logging platform.

The lab guided you through configuring log inputs, testing with sample data, and utilizing Graylog's querying capabilities for log analysis. You also created a customizable dashboard to visualize log insights, demonstrating Graylog's practical applications for monitoring and troubleshooting.