# Introduction In this project, you will learn how to create a bar chart using the ECharts JavaScript library to display student achievement statistics. ECharts is a powerful data visualization tool that can help you create interactive and visually appealing charts to present your data. ## 👀 Preview 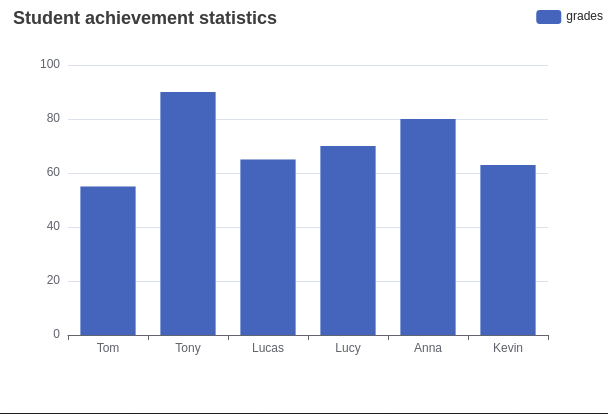 ## 🎯 Tasks In this project, you will learn: - How to fix an error in the initial code to display the chart correctly - How to modify the x-axis and y-axis settings to ensure the chart is displayed in the correct direction - How to adjust the data in the series to match the order of the x-axis labels ## 🏆 Achievements After completing this project, you will be able to: - Initialize an ECharts instance and configure the chart options - Define the x-axis and y-axis properties to control the chart's appearance - Update the data in the series to match the desired visualization
Click the virtual machine below to start practicing