# Introduction In this project, you will learn how to create a line chart using the ECharts library. The chart will display the number of hours the user spends on their phone each day of the week. ## 👀 Preview 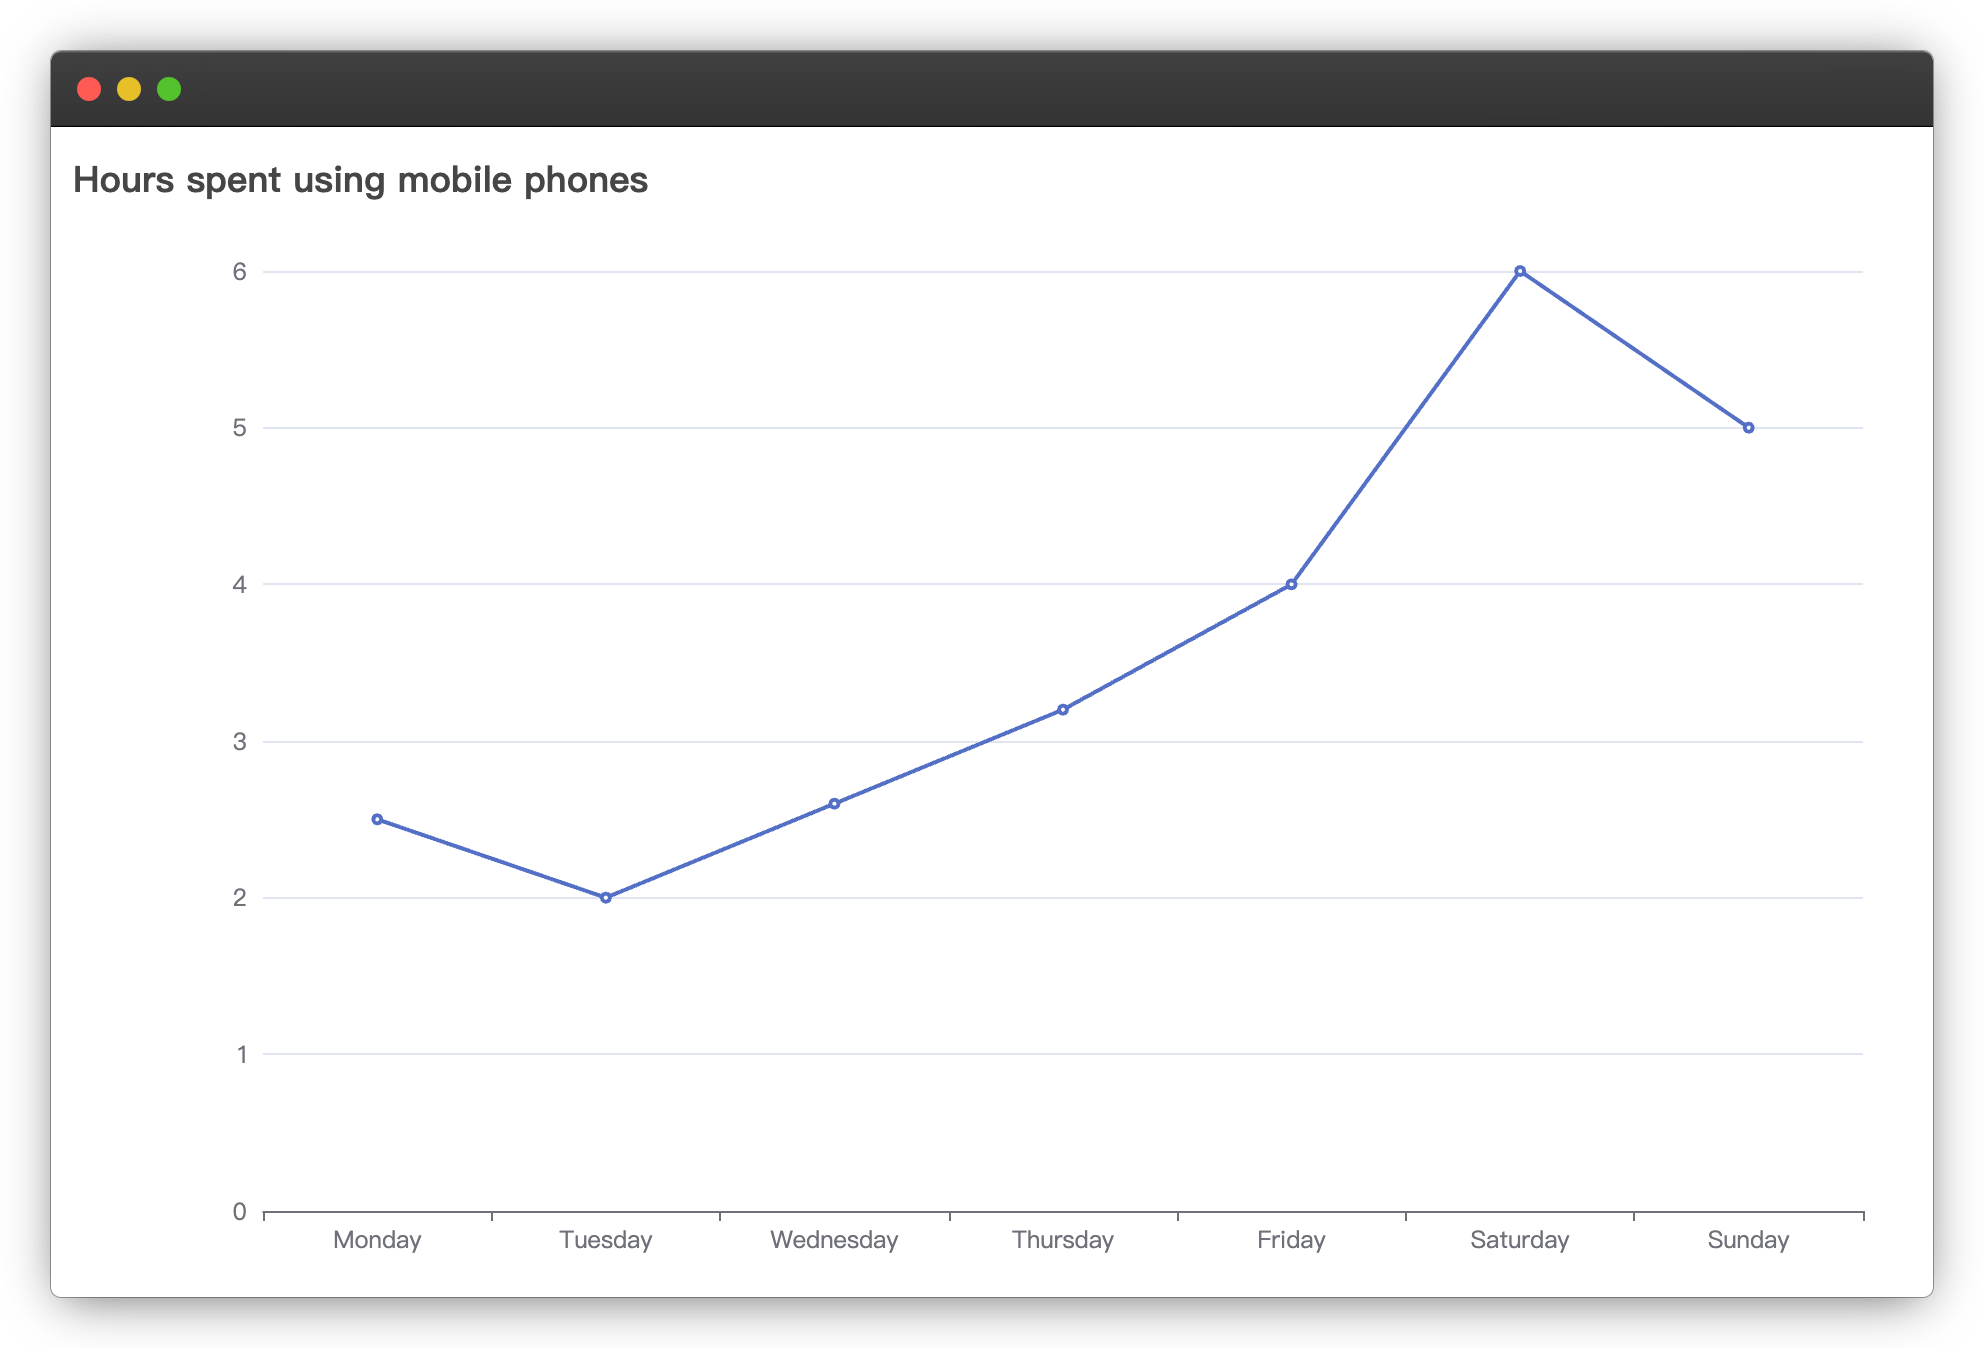 ## 🎯 Tasks In this project, you will learn: - How to set up the project and open the necessary files - How to fix an error in the ECharts configuration - How to understand the configuration of the line chart - How to customize the chart by modifying the configuration ## 🏆 Achievements After completing this project, you will be able to: - Use the ECharts library to create a line chart - Configure the chart's title, axes, and data series - Customize the chart by modifying the configuration
Click the virtual machine below to start practicing