# Introduction In this project, you will learn how to fetch data from a JSON file, render the protein content of different foods, and create an Echarts pie chart to visualize the data. This project aims to provide you with a hands-on experience in working with data manipulation and data visualization using JavaScript. ## 👀 Preview 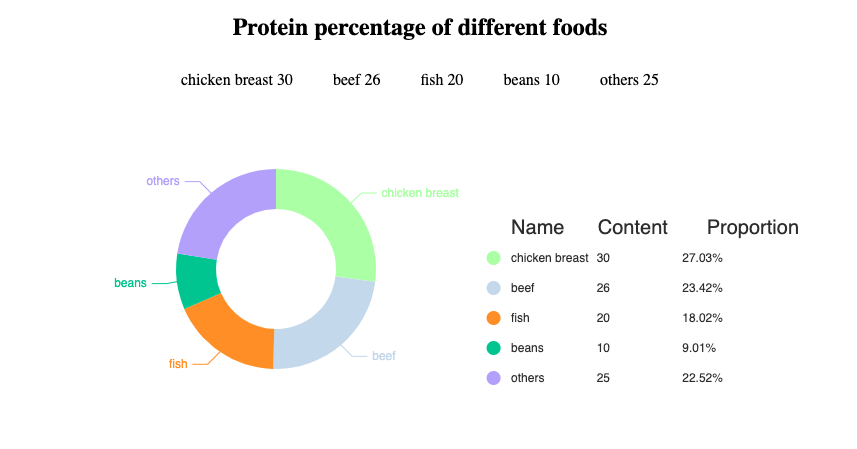 ## 🎯 Tasks In this project, you will learn: - How to fetch data from a JSON file using the Fetch API - How to render the protein content of different foods on the web page - How to create an Echarts pie chart to visualize the protein content data ## 🏆 Achievements After completing this project, you will be able to: - Fetch data from a JSON file and process the data - Dynamically render HTML elements based on the fetched data - Use the Echarts library to create an interactive pie chart - Integrate data visualization into a web application
Click the virtual machine below to start practicing