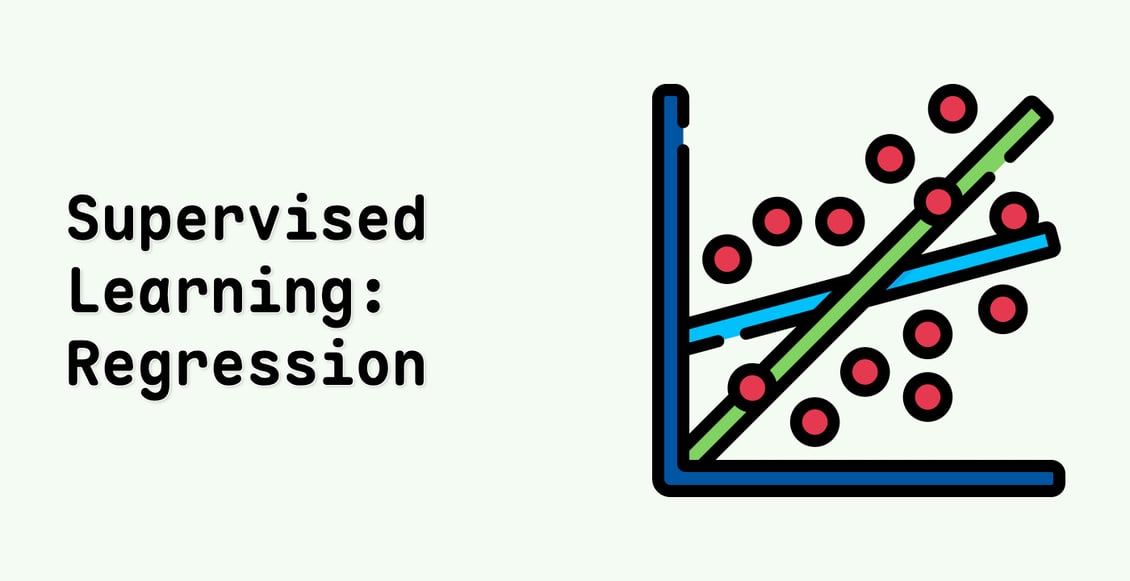
Learn how supervised regression turns labeled data into numerical predictions across seven Jupyter notebooks. You will move from the meaning of supervised learning to least-squares linear models, polynomial feature expansion, error-based model comparison, and Ridge and LASSO regularization.
The course combines mathematical derivations with Python and scikit-learn. Housing, vaccine, Bitcoin, and synthetic matrix examples let you practice fitting curves, evaluating predictions, recognizing when model complexity becomes harmful, and understanding how regularization changes coefficients.
What You Will Learn
- Distinguish supervised learning, regression, and classification tasks
- Derive ordinary least squares and implement linear regression with NumPy
- Fit scikit-learn linear models to Boston and Beijing housing data
- Assess housing predictions and inspect model coefficients
- Create polynomial features, compare linear and polynomial fits, and select a degree using error
- Fit historical Bitcoin data with third- and higher-degree polynomial regression
- Explain ill-conditioned least squares and compare Ridge and LASSO regularization paths
- Calculate Ridge coefficients directly and compare them with scikit-learn
Who This Course Is For
This course is for Python learners who want to understand regression mechanics rather than treat estimators as black boxes. It suits students beginning supervised machine learning who are ready to connect formulas, matrices, plots, and model APIs. The mathematical sections and code-completion tasks assume more than first-day Python knowledge.
Prerequisites: Basic Python, NumPy, Pandas, plotting, algebra, and simple matrix operations are recommended. Familiarity with train/test data and functions will help; prior regression experience is not required.
Learning environment: All seven activities run in a provided Ubuntu 22.04 Jupyter environment. Prepared notebooks include explanations, visualizations, supplied data files, runnable examples, and implementation sections to complete.
Frequently Asked Questions
Does the course derive regression formulas or only use scikit-learn?
It does both. You work through least-squares and Ridge coefficient calculations, implement selected steps with NumPy and SciPy, and then compare those results with scikit-learn models.
Which prediction examples are included?
Examples include Boston and Beijing housing prices, vaccine-related data for polynomial fitting, historical Bitcoin data, and a Hilbert-matrix example that exposes instability in ordinary least squares.
How are models evaluated?
The notebooks use held-out data, visual comparisons, mean absolute error, and mean squared error. Polynomial exercises compare several degrees to show how complexity affects prediction error.
Does the Bitcoin lab predict current prices or provide financial guidance?
No. It fits polynomial curves to a historical 2010–2018 data set as a regression exercise. It is not a live forecasting system and should not be used for investment decisions.